The Chi-Square Test widely examines relationships between categorical variables as a statistical method. Researchers and analysts apply it in hypothesis testing across various fields, including business, healthcare, and social sciences. This guide will explain the fundamentals, its types, applications, and how to interpret the results.
What is the Chi-Square Test?
The Chi-Square Test is a statistical test that determines whether there is a significant association between two categorical variables. It evaluates how likely it is that any observed differences between expected and actual frequencies occurred by chance.
Types of Chi-Square Tests
There are two main types:
- Chi-Square Test for Independence: Used to determine whether two categorical variables are related. It is commonly used in contingency tables.
- Chi-Square Goodness-of-Fit Test: Used to determine if a sample distribution fits an expected distribution.
Chi-Square Test Using R
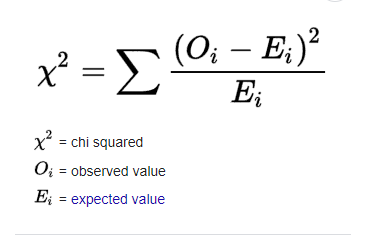
A chi-square test is used to analyze nominal (sometimes known as categorical) data. It is pronounced kai and is frequently written as a χ2 test. It’s used to compare the observed frequencies in each sample’s response categories. The null hypothesis indicates that the nominal variables have no relationship, that they are independent. The hypothesis are as follow,
- H0: There is no relationship between the nominal variables or variables are independent.
- H1: H0 is not true.
>>>>>>rc=”https://www.statisticalaid.com/wp-content/uploads/2021/10/1.png” alt=”chi-square test” width=”371″ height=”235″ />
Creating or Importing data
In this step, we have to import our data into R or we can generate a data set for example.
Let’s create some nominal data:
set.seed(150)
data <- data.frame(sampleA = sample(c("Positive","Positive","Negative"), 300, replace = TRUE), sampleB = sample(c("Positive","Positive","Negative"), 300, replace = TRUE)) Perform the chi-square test using the chisq.test function: test <- chisq.test(x = data$sampleA, y = data$sampleB) Analyse the result: > test
Pearson’s Chi-squared test with Yates’ continuity correction,
data: data$sampleA and data$sampleB
X-squared = 1.7444, df = 1, p-value = 0.1866
p-value
Interpretation of Chi-square test
To interpret the chi-square test we use p-value. If the p-value is less or equal to 0.05 then we may reject the null hypothesis that means the categorical variables are independent. Since the p-value is 0.1866, which exceeds the 5% significance level, we cannot reject the null hypothesis.
Chi-Square (χ2) statistic
A large χ² statistic allows researchers to reject the null hypothesis. To determine the required size, they calculate the critical value using the degrees of freedom and the significance level.
In our example, we have 1 degree of freedom. Using a table of probabilities for the χ2 distribution (example here), we can see that the critical χ2 value is 3.841. Therefore, the null hypothesis can be rejected where χ2 >= 3.841, but in this case, it is below 3.841 and the null hypothesis, therefore, cannot be rejected.
Learn Data Science and Machine Learning
Applications
- Market Research: Understanding consumer preferences and behaviors.
- Healthcare: Identifying relationships between diseases and lifestyle factors.
- Social Sciences: Analyzing survey responses and demographic patterns.
- Business Analytics: Evaluating customer satisfaction and product preferences.
Limitations
- Requires a sufficiently large sample size.
- Only applicable to categorical data.
- Assumes independent observations.
- Cannot establish causality, only association.
Conclusion
The Chi-Square Test is a powerful statistical tool for analyzing categorical data and identifying significant relationships. By understanding its applications, limitations, and how to interpret results, researchers and analysts can make data-driven decisions with confidence.
If you found this guide helpful, share it with your colleagues or explore other statistical techniques to deepen your analytical skills!
Data Analysis Using R/R Studio
- Import data into R
- Principal component analysis (PCA) code
- Canonical correlation analysis (CCA) code
- Independent component analysis (ICA) code
- Cluster Analysis using R
- One-way ANOVA using R
- Two-way ANOVA using R
- Paired sample t-test using R
- Random Forest in R