Hypothesis testing helps statisticians infer information about populations from sample data. Researchers widely apply it in medicine, economics, and social sciences to validate claims and draw meaningful conclusions. Statistical hypothesis testing involves performing a test based on observed data, modeling it as the realized values taken by a collection. According to Investopedia, “Hypothesis testing is an act in statistics whereby an analyst tests an assumption regarding a population parameter.”

What is Hypothesis Testing?
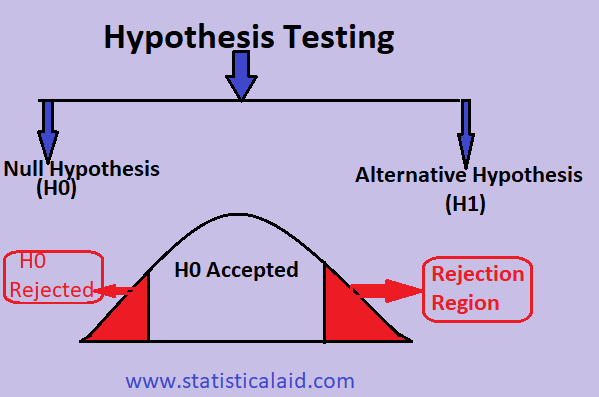
In statistics, we may divide statistical inference into two major part: one is estimation and another is hypothesis testing. Before hypothesis testing we must know about hypothesis. A statistical hypothesis is a statement about a population which we want to verify on the basis of information which contained in a sample. More precisely, Hypothesis testing is a statistical method that helps researchers determine whether there is enough evidence to reject a null hypothesis (H₀) in favor of an alternative hypothesis (H₁). Researchers analyze sample data to infer properties about the population from which they draw the sample.
Key Components of Hypothesis Testing
- Null Hypothesis (H₀): The assumption that there is no effect or no difference.
- Alternative Hypothesis (H₁): The claim that contradicts H₀ and suggests a significant effect or difference.
- Significance Level (α): The probability of rejecting H₀ when it is actually true (commonly set at 0.05).
- Test Statistic: A value computed from sample data used to determine whether to reject H₀.
- P-Value: The probability of obtaining results as extreme as the observed data, given that H₀ is true.
- Decision Rule: If the p-value is less than α, reject H₀; otherwise, fail to reject H₀.
Types of Hypothesis Tests
- Z-Test: Used when the population variance is known and the sample size is large (n > 30).
- T-Test: Used for comparing means when the population variance is unknown.
- One-sample t-test: Compares a sample mean to a known population mean.
- Two-sample t-test: Compares means of two independent samples.
- Paired t-test: Compares means of two related samples.
- Chi-Square Test: Used for categorical data to test relationships between variables.
- ANOVA (Analysis of Variance): Compares means among multiple groups.
- Wilcoxon Signed-Rank Test: A non-parametric alternative for comparing paired data.
- Mann-Whitney U Test: A non-parametric alternative for comparing independent samples.
Steps in Hypothesis Testing
1: Formulate the Hypotheses: Define H₀ and H₁ clearly based on the research question.
2: Select the Appropriate Test: Choose the right statistical test based on data type and assumptions.
3: Set the Significance Level (α): Determine the acceptable risk level, typically 0.05.
4: Compute the Test Statistic: Calculate the test statistic based on sample data.
5: Determine the P-Value: Compare the p-value with α to make a decision.
6: Make a Conclusion:
- If p-value < α, reject H₀ (statistically significant result).
- If p-value ≥ α, fail to reject H₀ (no sufficient evidence).
Example of Hypothesis Testing
Few examples of statistical hypothesis related to our daily life are given below-
- The court assumes that the indicted person is innocent.
- A teacher assumes that 80% of the student of his college is from a lower-middle-class family.
- A doctor assumes that 3D(Diet, Dose, Discipline) is 95% effective to the diabetes patient.
- A beverage company claims that its new cold drinks are superior to the other drinks available in the market, etc.
- Evolving a test statistic
- To know the sampling distribution of the test statistic
- Selling of hypotheses testing conventions
- Establishing a decision rule that leads to an inductive inference about the probable truth.
Null Hypothesis
A null hypothesis is a statement, which tells us that no difference exists between the parameter and the statistic being compared to it. According to Fisher, any hypothesis tested for its possible rejection is called a null hypothesis and is denoted by H0.
Alternative Hypothesis
For example, with a coin-tossing experiment, the null and alternative hypothesis may be formed as,
H0: the coin is unbiased.
H1: the coin is biased.
Depending on the population distribution, the statistical hypothesis are two types,
- Simple hypothesis: A hypothesis is called a simple hypothesis when it completely specifies the distribution of the population.
- Composite hypothesis: In contrast, a hypothesis is called a composite hypothesis when it does not completely specify the population’s distribution.
Common Errors in Hypothesis Testing
- Type I Error: Rejecting H₀ when it is true (false positive).
- Type II Error: Failing to reject H₀ when it is false (false negative).
- P-Hacking: Manipulating data to obtain significant results.
- Ignoring Assumptions: Using inappropriate tests for data types.
Hypothesis testing is an essential statistical tool for decision-making. By understanding its principles and proper implementation, researchers can derive valid conclusions from data and avoid common pitfalls.