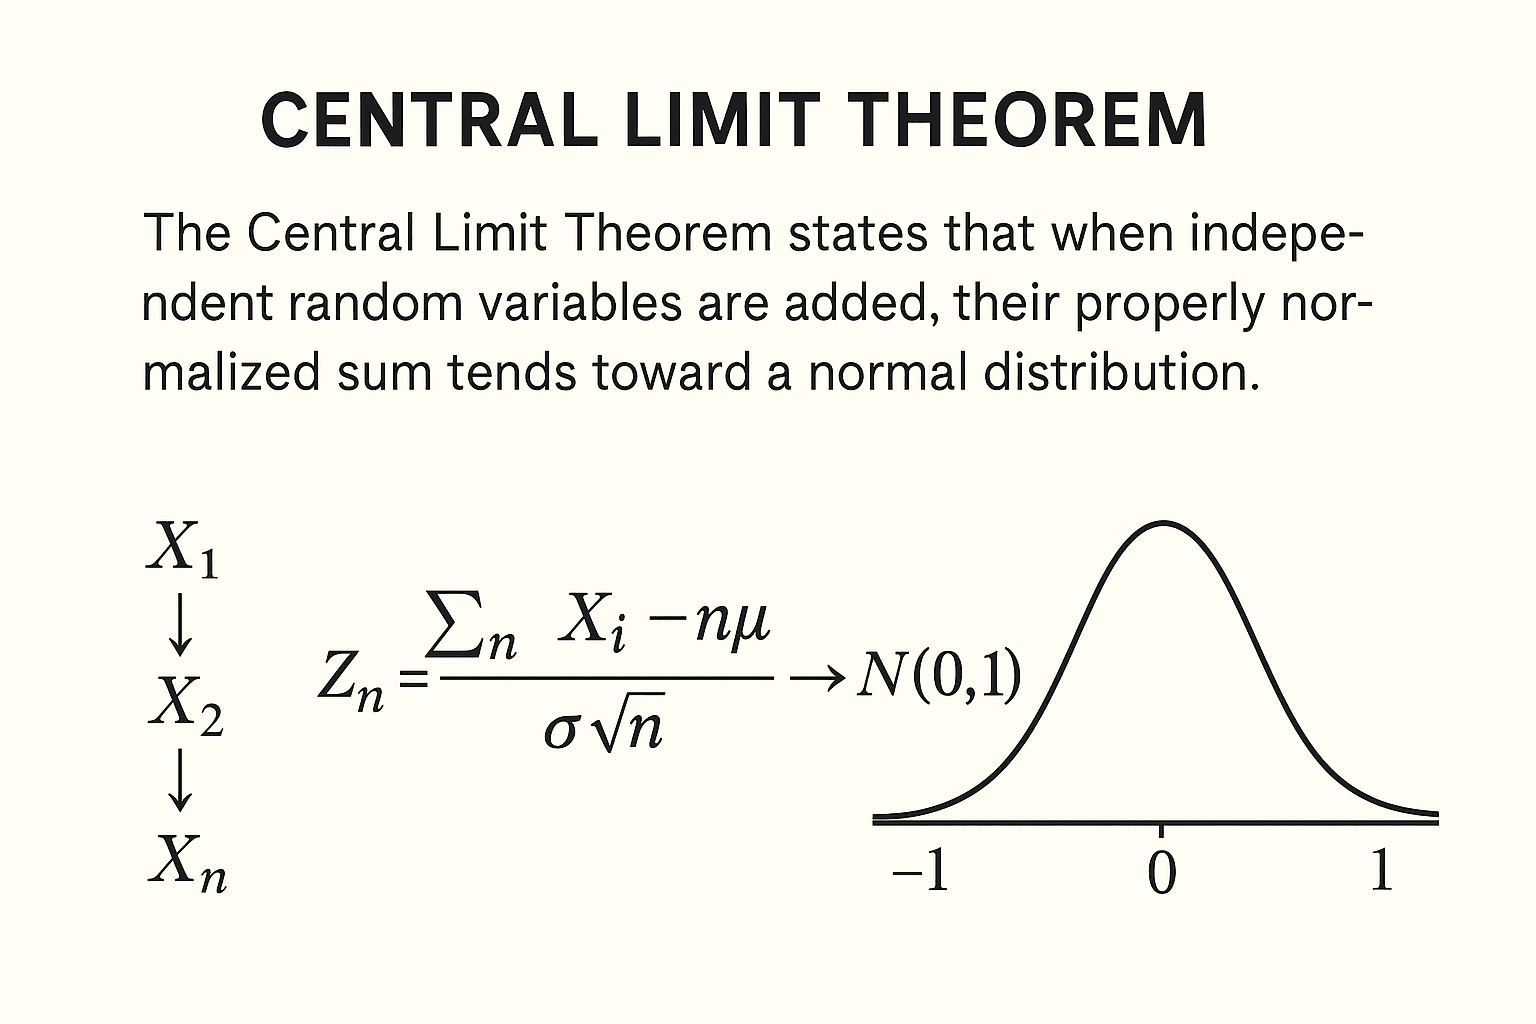
Explanatory variable
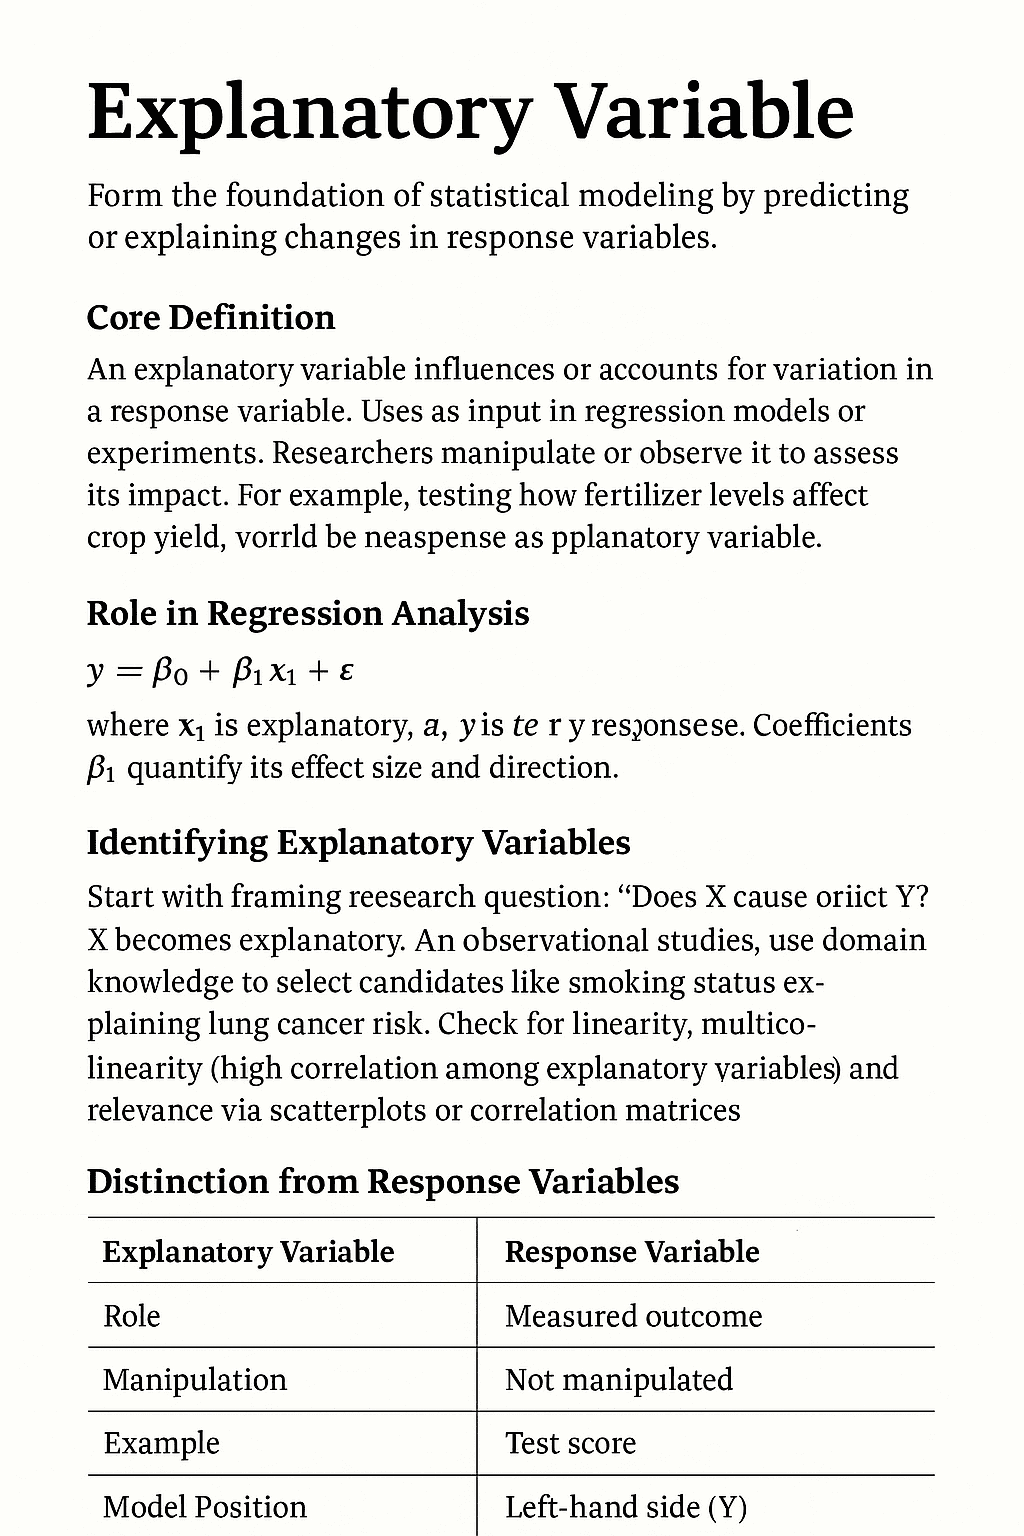
In the world of statistics and data analysis, understanding relationships between variables is central to drawing meaningful conclusions. Whether you’re analyzing the impact of study time on exam scores, advertising spend on sales, or temperature on crop yield, one concept consistently plays a pivotal role: the explanatory variable. Also known as the independent variable, the … Read more