Graphical Representation of Data

Graphical Representation

In today’s data-driven world, the ability to understand and interpret information is paramount. While raw data can be overwhelming and difficult to decipher, graphical representation transforms it into a digestible and insightful format. From simple bar charts to complex network diagrams, visuals empower us to quickly grasp trends, identify patterns, and communicate complex information effectively. … Read more

Stem and Leaf Plots

stem and leaf plots

Data analysis can feel like navigating a labyrinth of numbers. But sometimes, the most effective tools for understanding your data are also the simplest. Enter the stem and leaf plots, a powerful yet easily grasped method for organizing and visualizing data, allowing you to quickly identify patterns, distributions, and outliers. This article dives deep into … Read more

Random vs Systematic Error: Measurements Uncertainty

Random error vs Systematic Error

In science and engineering, accuracy is paramount. Whether you’re conducting experiments in a lab, analyzing survey data, or manufacturing precision parts, understanding the accuracy of your measurements is crucial. However, perfection is often unattainable, and measurements are invariably subject to error. These errors can be broadly classified into two categories: random error and systematic error. … Read more

How to choose the right statistical test

choosing statistical test

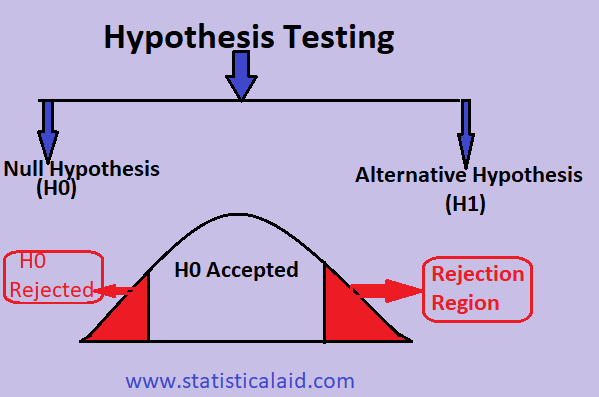
Statistical tests are used to test hypotheses relating to either the difference between two or more samples/groups, or the relationship between two or more variables. What is a statistical test? Statistical tests assume a null hypothesis. Depending on what you are testing, the null hypothesis is that there is no difference between the sample or … Read more

Statistical Test of Significance

In the world of data analysis and research, the statistical test of significance plays a crucial role in determining whether an observed effect or relationship is real or simply due to random chance. It helps researchers and analysts draw valid conclusions from data, ensuring accuracy and reliability in decision-making. This article will provide a comprehensive … Read more

Multicollinearity: Why occur and how to remove

multicollinearity-scatter plot

What is multicollinearity? Multicollinearity is a statistical situation that occurs in a regression model when two or more predictors or explanatory or independent variables are highly correlated to each other. In this situation, there exists a strong correlation among the independent variables. For example, let us consider a multiple regression model as, Y=α+βX1+ βX2+ βX3+ … Read more

An Intuitive study of Logistic Regression Analysis

logistic regression

Logistic Regression is a fundamental statistical method widely used in machine learning, data science, and various fields of research. Despite its simplicity, it remains a powerful tool for binary classification problems and has numerous real-world applications ranging from medical diagnoses to customer churn prediction. More precisely, It is a statistical technique to find the association … Read more

Data Levels of Measurement (Nominal, Ordinal, Interval, Ratio) in Statistics

Data levels in statistics indicates the measurement levels in statistics. In statistics, the statistical data whether qualitative or quantitative, are generated or obtain through some measurement or some observational process. Measurement is essentially the task of assigning numbers to observations according to certain rules. The way in which the numbers are assigned to observations determines … Read more

Correlation Analysis definition, formula and step by step procedure

The relationship between two or more random variables are generally defined as the correlation. It is the major part of bivariate analysis. When variables are found to be related, we often want to know how close the relationship is. The study of the relationship is known as correlation analysis. The primary objective of correlation is … Read more

Skewness and Kurtosis in Statistics (shape of distributions)

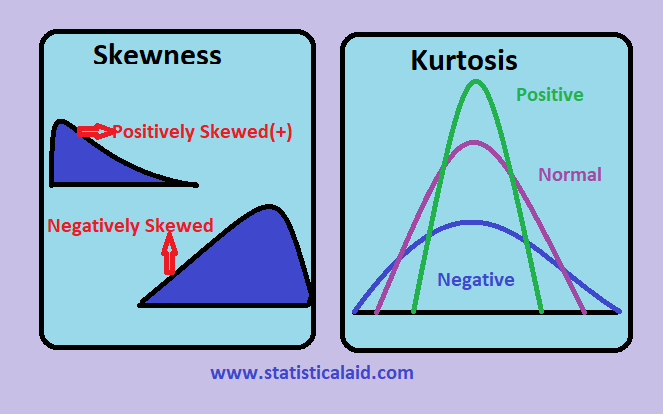
Skewness and kurtosis are two important measures in statistics. Kurtosis refers peakedness of a distribution and Skewness refers lack of symmetry. Skewness Literally, skewness means the ‘lack of symmetry’. We study skewness to have an idea about the shape of the curve which we can draw with the help of the given data. A distribution is … Read more

You cannot copy content of this page