Skewness and kurtosis are two important measures in statistics. Kurtosis refers peakedness of a distribution and Skewness refers lack of symmetry.

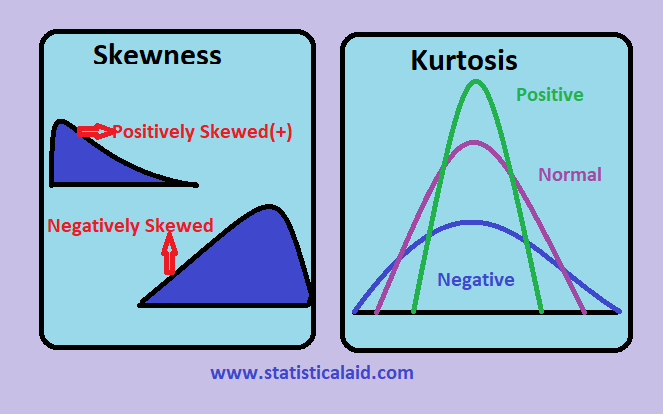
Skewness
- Mean, median, mode fall at different points, i.e, Mean ≠ Median ≠ Mode.
- Quartiles are not equidistant from median.
- The curve drawn with the help of the given data is not symmetrical but stretched more to one side than the other.
The lack of symmetry in a distribution is always determined with reference to a normal distribution, which is always symmetrical. Any departure of a distribution from symmetry leads to an asymmetric distribution and in such cases, we call this distribution as skewed. The skewness may be either positive or negative. Absence of skewness makes the distribution symmetrical.
It is important to emphasize that skewness of a distribution cannot be determined simply by inspection. If we understand the differences between the mean, median and the mode, we should be able to suggest a direction of skew.We can define the skewness of a frequency distribution in three different shapes as following-
Shape of distributions


Measures of Skewness
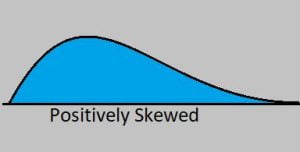
- If mean > mode, the distribution is positively skewed.
- If mean < mode, the distribution is negatively skewed.
- If mean = mode, the distribution is not skewed or symmetrical.
![\[ \beta _{1}=\frac{\mu _{3}^{2}}{\mu _{2}^{3}}; where \beta _{1}=skewness, \mu _{2}=2nd central moment, \mu _{3}=3rd central moment. \]](https://www.statisticalaid.com/wp-content/ql-cache/quicklatex.com-509d3f58ea0b10aa40795a174113d049_l3.png "Rendered by QuickLaTeX.com")
![\[ \gamma _{1}=\sqrt{\frac{\mu _{3}^{2}}{\mu _{2}^{3}}}; where \gamma _{1}=skewness, \mu _{2}=2nd central moment, \mu _{3}=3rd central moment. \]](https://www.statisticalaid.com/wp-content/ql-cache/quicklatex.com-37018319ea3a2cef320bd905ff9bdb15_l3.png "Rendered by QuickLaTeX.com")
Kurtosis

Measures of Kurtosis
![\[ \beta _{2}=\frac{\mu _{4}}{\mu _{2}^{2}}; where \beta _{2}=kurtosis, \mu _{2}=2nd central moment, \mu _{4}=4th central moment. \]](https://www.statisticalaid.com/wp-content/ql-cache/quicklatex.com-fdbbef162786a88b68ac7a67f9c01066_l3.png "Rendered by QuickLaTeX.com")
- If kurtosis>3, the distribution is leptokurtic.
- If kurtosis<3, the distribution is platykurtic.
- If kurtosis=3, the distribution is mesokurtic.
1. Mesokurtic
Data that follows a mesokurtic distribution shows an excess kurtosis of zero or close to zero. This means that if the data follows a normal distribution, it follows a mesokurtic distribution.
2. Leptokurtic
Leptokurtic indicates a positive excess kurtosis. The leptokurtic distribution shows heavy tails on either side, indicating large outliers. In finance, a leptokurtic distribution shows that the investment returns may be prone to extreme values on either side. Therefore, an investment whose returns follow a leptokurtic distribution is considered to be risky.
3. Platykurtic
A platykurtic distribution shows a negative excess kurtosis. The kurtosis reveals a distribution with flat tails. The flat tails indicate the small outliers in a distribution. In the finance context, the platykurtic distribution of the investment returns is desirable for investors because there is a small probability that the investment would experience extreme returns.
Application of Skewness and Kurtosis
Skewness and kurtosis are important statistical measures that help in understanding the shape and distribution of a dataset. They are widely used in various fields, including finance, economics, quality control, and risk management.
Application of Skewness
Skewness measures the asymmetry of a dataset’s distribution. It helps determine whether data is symmetrically distributed or has a tendency to lean towards one side.
(1) Finance & Investment: Helps in analyzing the return distributions of stocks, bonds, and other assets. A positively skewed distribution suggests the presence of occasional high returns, while a negatively skewed distribution implies frequent small gains but rare large losses.
(2) Economics & Business Analytics: Used in income distribution analysis. A right-skewed distribution suggests a small percentage of the population earns significantly more than the majority.
(3) Quality Control & Manufacturing: In process control, skewness helps in detecting systematic bias in production quality.
(4) Medical & Biological Research: Used in analyzing patient recovery times, response times to treatment, or the spread of diseases.
Application of Kurtosis
Kurtosis measures the “tailedness” of a distribution, indicating whether data has heavy or light tails compared to a normal distribution.
(1) Finance & Risk Management: High kurtosis (leptokurtic) suggests extreme values (outliers) are more common, which is crucial in risk assessment for stock market investments. Low kurtosis (platykurtic) suggests fewer outliers, indicating stable returns.
(2) Econometrics & Business Forecasting: Helps in identifying anomalies in economic trends, market crashes, or extreme demand-supply shocks.
(3) Industrial Quality Control: Identifies production defects by highlighting rare but severe deviations in product quality.
(4) Medical & Environmental Science: Used in identifying rare diseases, extreme weather events, or pollutant concentrations that might pose health risks. Both skewness and kurtosis provide deeper insights into data distribution beyond simple mean and variance. Their application is essential in decision-making processes across various industries. Data Science
Comparison between Skewness and Kurtosis
Skewness and kurtosis are essential statistical tools that help analyze and interpret the shape of data distributions. Skewness measures the asymmetry of a dataset, determining whether values are concentrated more on one side of the mean. Positive skewness indicates a long right tail, while negative skewness suggests a long left tail. This is particularly useful in finance, economics, and quality control, where understanding data trends can influence risk assessment and decision-making.
Kurtosis, on the other hand, evaluates the “tailedness” of a distribution. A high kurtosis value (leptokurtic) signifies a higher probability of extreme outliers, whereas low kurtosis (platykurtic) suggests a more uniform data spread. In fields like financial risk management, medical research, and environmental science, kurtosis helps identify the likelihood of extreme events, such as market crashes or rare diseases, aiding in predictive analysis and preventive measures.
Both skewness and kurtosis provide deeper insights beyond basic measures like mean and variance, allowing for a more comprehensive understanding of data behavior. Their application in diverse industries ensures improved forecasting, risk management, and decision-making processes. By incorporating these measures, analysts can better understand the patterns within datasets, enabling more informed and strategic choices across various fields.