
The relationship between two or more random variables are generally defined as the correlation. It is the major part of bivariate analysis. When variables are found to be related, we often want to know how close the relationship is. The study of the relationship is known as correlation analysis. The primary objective of correlation is to measure the strength or degree of linear association between two or more variables.
More precisely, Correlation analysis measures and analyzes the strength and direction of the relationship between two or more variables. Understanding how variables are related can provide invaluable insights across various fields like economics, business, social sciences, and health sciences. Correlation analysis helps researchers, analysts, and decision-makers identify patterns, predict outcomes, and uncover hidden relationships within data sets.
In this article, we will explore the concept of correlation analysis, its types, methods, and applications, providing you with a clear understanding of how to use it effectively in data analysis.
What is Correlation Analysis?
Correlation analysis refers to the statistical technique that quantifies the relationship between two or more variables. It reveals whether an increase or decrease in one variable leads to an increase or decrease in another variable. This is useful in identifying trends, making predictions, and testing hypotheses.
The most commonly used correlation coefficient is Pearson’s correlation coefficient, which measures the strength and direction of a linear relationship between variables.
Types of Correlation
Correlation can be classified into several types based on the relationship between the variables. The most common types include:
1. Positive Correlation: In a positive correlation, as one variable increases, the other variable also increases. For example, as the temperature increases, ice cream sales tend to rise. The correlation coefficient (r) for a positive correlation lies between 0 and +1.
Example: As the hours spent studying increase, exam scores tend to increase as well.
2. Negative Correlation: In a negative correlation, as one variable increases, the other variable decreases. A perfect negative correlation would have a correlation coefficient of -1.
Example: As the amount of time spent watching television increases, the time spent on physical activity decreases.
3. No Correlation: In this case, there is no discernible relationship between the two variables. Changes in one variable do not affect the other.
Example: The correlation between a person’s shoe size and their salary would likely have no correlation.
4. Zero Correlation: Zero correlation refers to the absence of a relationship between two variables. The correlation coefficient in this case is 0.
Example: The correlation between the day of the week and a person’s height would be zero, as there is no relationship.
Key Methods of Correlation Analysis
1. Pearson’s Correlation Coefficient (r)
Pearson’s correlation coefficient measures the strength and direction of the linear relationship between two variables. It ranges from -1 to +1, where:
- +1 indicates a perfect positive linear relationship.
- -1 indicates a perfect negative linear relationship.
- 0 indicates no linear relationship.
Many researchers widely use this method because they find it easy to compute and interpret. However, it assumes that the data is normally distributed and that a linear relationship exists between the variables.
2. Spearman’s Rank Correlation
Researchers use Spearman’s rank correlation when they encounter data that is not normally distributed or when the relationship between variables is nonlinear. It works by ranking the data and then measuring the correlation between the ranks.
Spearman’s correlation coefficient also ranges from -1 to +1. A coefficient closer to +1 indicates a strong positive monotonic relationship, while -1 indicates a strong negative monotonic relationship.
3. Kendall’s Tau
Kendall’s Tau is a non-parametric correlation coefficient that measures the strength and direction of the association between two variables. It is particularly useful when there are ties in the data. Unlike Pearson’s coefficient, Kendall’s Tau is less sensitive to outliers and is often preferred for small data sets.
How to Perform Correlation Analysis
Performing correlation analysis involves the following steps:
1: Collect the Data: Gather the data for the variables you wish to analyze. The data should be numeric and can either be from observational studies, experiments, or surveys.
2: Visualize the Data: Before performing correlation analysis, it’s helpful to create scatter plots or other visual representations to identify any apparent relationships between the variables.
3: Calculate the Correlation Coefficient: Use a statistical tool or software like Excel, Python (with libraries like NumPy or Pandas), or R to calculate the correlation coefficient (Pearson’s, Spearman’s, or Kendall’s) between the variables.
4: Interpret the Results: The calculated correlation coefficient will give you an idea of the strength and direction of the relationship. Values closer to +1 or -1 indicate stronger relationships, while values near 0 suggest weak or no correlation.
5: Check for Significance: It is essential to check if the correlation result is statistically significant. This can be done through hypothesis testing to determine whether the observed correlation is due to chance or if it reflects a true relationship.
Measuring the Correlation
For n pairs of sample observations (x1,y1), (x2,y2),…,( xn, yn), the correlation coefficient r can be defined as,
![\[ r=\frac{\sum (x_{i}-\bar{x})(y_{i}-\bar{y})}{\sqrt{(x_{i}-\bar{x})^{2}(y_{i}-\bar{y})^{2}}}=\frac{S_{xy}}{\sqrt{S_{xx}S_{yy}}} \]](https://www.statisticalaid.com/wp-content/ql-cache/quicklatex.com-016d51cb6b3cb7bc651bb5222fad6e18_l3.png "Rendered by QuickLaTeX.com")
Correlation coefficient r is a statistical measure that quantifies the linear relationship between a pair of variables.
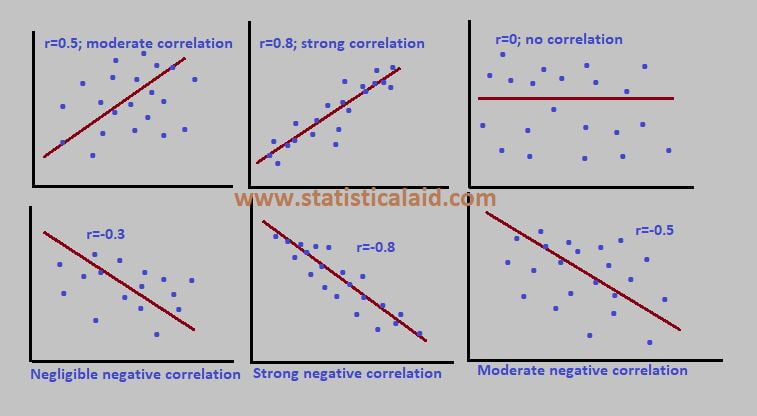
The value of correlation coefficient (r) lies between -1 to +1. When the value of –
- r=0; there is no relation between the variable.
- r=+1; perfectly positively correlated.
- r=-1; perfectly negatively correlated.
- r= 0 to 0.30; negligible correlation.
- r=0.30 to 0.50; moderate correlation.
- r=0.50 to 1 highly correlated.
Properties of Correlation Coefficient
The correlation coefficient has some appealing properties which are following-
- The correlation coefficient is a symmetric measure.
- The value of correlation coefficient lies between -1 to +1.
- It is dimensionless quantity.
- It is independent of origin and scale of measurement.
- The correlation coefficient will be positive or negative depending on whether the sign of numerator of the formula is negative or positive.
Rank Correlation Analysis
When the two variables had a joint normal distribution and the conditional variance of one variable given the other was same then we may use other technique generally known as the rank correlation. Rank correlation is defined by Spearman’s rank correlation. We recommended rank correlation when-
- The values of the variables are available in rank ordered form.
- The data are qualitative in nature and can be ranked in some order.
![\[ r_{s}=1-\frac{6\sum d_{i}^{2}}{n(n^2-1)} \]](https://www.statisticalaid.com/wp-content/ql-cache/quicklatex.com-7448a7a2358aefc386707fe3119aece1_l3.png "Rendered by QuickLaTeX.com")
where,
rs=Spearman’s correlation coefficient
di=The differences between ranks of the ith pair
n= The number of pairs included.
- Time series analysis
- Business forecasting
- Hypothesis testing
- Logistic Regression
- Inference
- Correlation Analysis
- Data analysis using spss
Correlation Analysis vs Regression Analysis
The contradictions between regression and correlation are given below-
- In correlation, we are generally interested in the measurement of the linear relationship between two or more variables. On the other hand, regression analysis doesn’t asses such relationship.
- In correlation analysis we consider any two or more variables. On the other hand, in regression there must need one dependent and one or more independent variables. Here the dependent variable is stochastic or random variable and the independent or explanatory variable is fixed.
- Correlation analysis provides a means of measuring the goodness of fit of the estimated regression line to the observed statistical data. On the other hand, regression analysis doesn’t provide any means to measure the goodness of fit but it tells about the average amount of change in the dependent variable to one unit change in the independent variable.
Applications of Correlation Analysis
Correlation analysis is used in a wide range of fields to draw meaningful conclusions from data. Some common applications include:
1. Finance: In finance, correlation analysis is used to study the relationship between different financial assets, such as stocks, bonds, or commodities. By understanding how assets move in relation to each other, investors can manage risk through diversification strategies.
2. Healthcare and Medicine: In medical research, correlation analysis helps establish relationships between variables like lifestyle factors (diet, exercise) and health outcomes (e.g., heart disease, diabetes). It can also be used to investigate correlations between symptoms and disease progression.
3. Marketing and Consumer Behavior: Businesses use correlation analysis to understand customer behavior. For example, correlating customer satisfaction with sales can help businesses tailor marketing strategies to improve performance.
4. Social Sciences: Researchers in sociology, psychology, and education use correlation analysis to examine relationships between variables like education level and income or stress levels and academic performance.
Limitations of Correlation Analysis
While correlation analysis is a powerful tool, it has certain limitations:
- Causality Is Not Established: Correlation does not imply causation. Just because two variables are correlated does not mean one causes the other. A third variable, known as a confounder, might influence both.
- Sensitivity to Outliers: Extreme values (outliers) can significantly affect the correlation coefficient, especially when using Pearson’s correlation.
- Assumes Linearity: Pearson’s correlation assumes a linear relationship. Non-linear relationships may not be well-represented by this method.
Conclusion
Correlation analysis is an essential tool in data analysis, allowing researchers and analysts to explore and understand relationships between variables. By calculating and interpreting correlation coefficients, professionals can draw insights, identify trends, and make data-driven decisions. However, it is important to remember that correlation does not imply causation, and other statistical tests should be used to explore deeper relationships.
By applying correlation analysis across different domains, you can improve predictions, inform decision-making, and better understand the complexities of the data you work with.