Measures of Dispersion in Statistics and its types

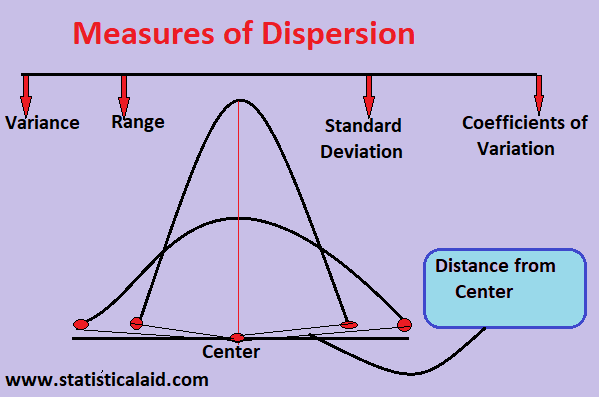
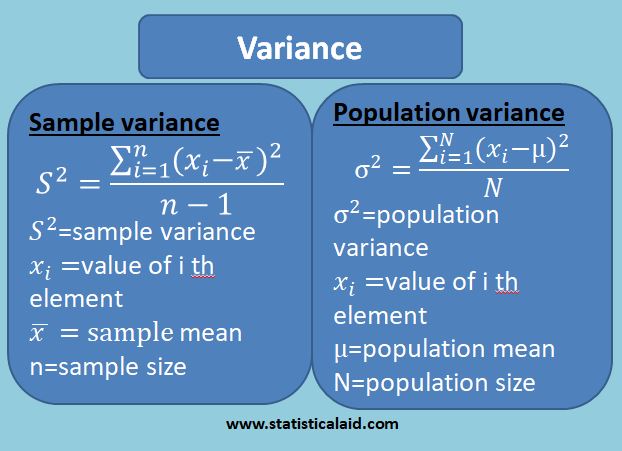
Measures of dispersion is statistical measure by which we determine how the observations spread out or scattered on each side of center. Variance and standard deviation is the most popular measures of dispersion. More precisely, Measures of dispersion in statistics refer to numerical values that describe the extent of variation or spread in a dataset. … Read more

Statistical Hypothesis Testing step by step procedure

Hypothesis testing helps statisticians infer information about populations from sample data. Researchers widely apply it in medicine, economics, and social sciences to validate claims and draw meaningful conclusions. Statistical hypothesis testing involves performing a test based on observed data, modeling it as the realized values taken by a collection. According to Investopedia, “Hypothesis testing is an … Read more

Variance and Standard Deviation in Statistics

Variance is one of the best measure of dispersion which measure the difference of all observation from the center value of the observations.       Population variance and standard deviation The average of the square of the deviations taken from mean is called variance. The population variance is generally denoted by σ2and its estimate … Read more

Geometric Mean definiton, formula and applications

The Geometric mean is a special types of average where we calculate the root of the product of a value of a set of observations. It is usually used to define various types of growth rates such as population growth, interest rates etc.    Formula of geometric mean By definition, the formula is as below,     … Read more

Harmonic Mean definition, formula and applications

The harmonic mean is the inverse of the arithmetic mean of the reciprocals of the observations of a set. It is a type of average generally used for numbers that represent a rate or ratio such as the precision and the recall in information retrieval and can be described as the reciprocal of the arithmetic mean … Read more

Arithmetic Mean definition, formula and applications

arithmetic mean

When someone says “average,” what’s the first thing that comes to mind? For most of us, it’s the simple act of adding up a bunch of numbers and dividing by how many numbers there are. That intuitive process is exactly what we call the Arithmetic Mean, and it’s by far the most common and fundamental … Read more

Measures of Central Tendency definition, types with advantages and disadvantages

central tendency

Measures of central tendency are numerical indices of statistical data that are generally indicative of the center, middle or representative of a data set. Understanding data is crucial in statistics, business, and research. One of the fundamental concepts in data analysis is measures of central tendency, which help summarize a dataset with a single representative … Read more

Statistical Data definition, types and requirements

statistical data

In today’s data-driven world, statistical data plays a crucial role in decision-making across industries. Whether in business, healthcare, finance, or research, statistics help analyze trends, make predictions, and improve efficiency. Understanding statistical data is essential for anyone looking to interpret numerical information accurately. This article explores the fundamentals of statistical data, its types, and practical … Read more

Intra-class vs Inter-class correlation in statistics

Inter-class vs Intra-class correlation

Inter-class correlation and intra-class correlation are two special cases of correlation analysis. Inter-class correlation shows the association among the groups and intra-class correlation shows the association within a group.   Intra class(a) vs Inter class(b) “Interclass” means among the groups.“Intraclass” means within groups. Inter-class correlation Inter-class correlation refers to the degree of association or agreement … Read more

Population vs Sample: Key Differences and Insights

population vs sample

In statistics, knowing the difference between population and sample is key. It helps in doing accurate and reliable research. Understanding this difference is vital for making good decisions and drawing conclusions. Statistics show that population and sample are closely related but different. The population is the whole group a researcher wants to study. On the … Read more

You cannot copy content of this page