Measures of central tendency are numerical indices of statistical data that are generally indicative of the center, middle or representative of a data set. Understanding data is crucial in statistics, business, and research. One of the fundamental concepts in data analysis is measures of central tendency, which help summarize a dataset with a single representative value. The three main measures of central tendency are Mean, Median, and Mode. These metrics provide valuable insights into the distribution and characteristics of a dataset.
In this blog, we will explore these measures in detail, their applications, advantages, and how to calculate them.
")
Definition of Central Tendency
It is a single value within the range of data which represents a group of individual values simply and concisely so that the mind can get a quick understanding of the general size of the individuals in the group. Since the value lies within the range of data, it is known as a measure of central tendency.
According to R.A. Fisher, “The inherent inability of a human to grasp in its entirely a large body of numerical data compels us to seek relatively few constants that will adequately describe the data”.
What is Measures of Central Tendency?
Measures of central tendency describe the center or typical value of a dataset. They help in understanding the overall trend and are widely used in fields such as economics, social sciences, finance, and data science.
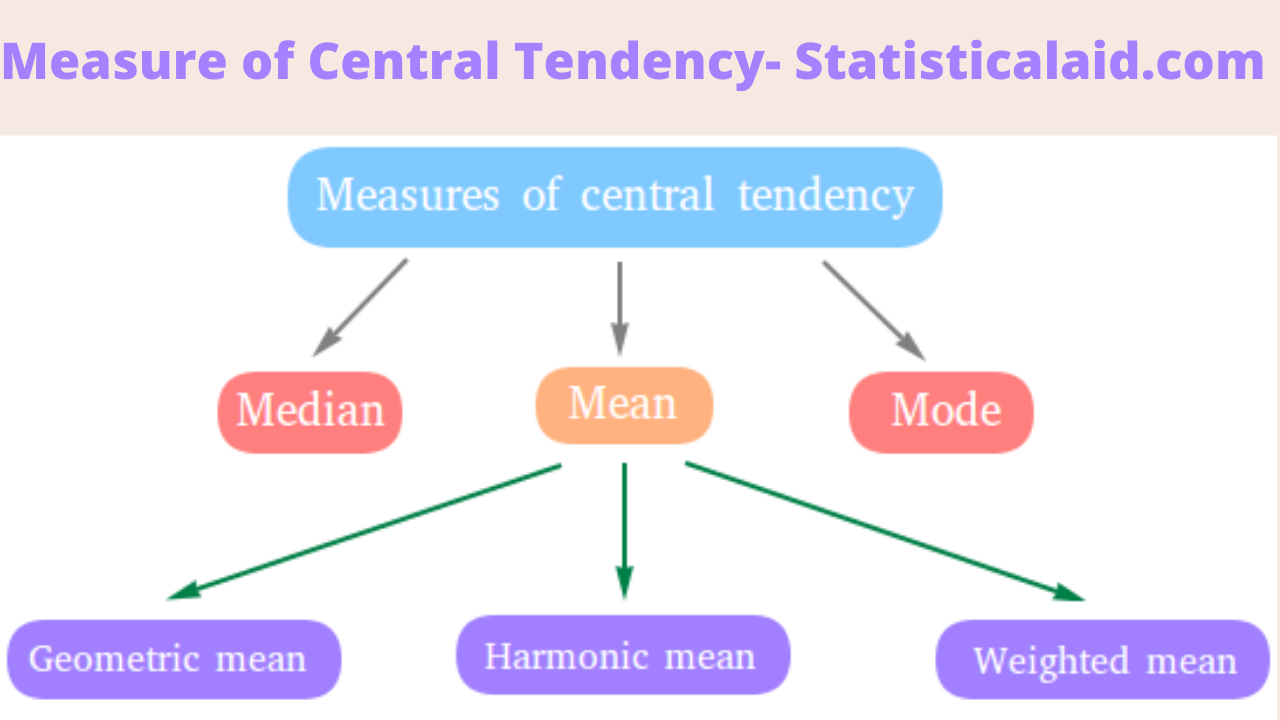
The three primary measures of central tendency are:
Mean (Arithmetic Average)
Median (Middle Value)
Mode (Most Frequent Value)
Each of these measures serves a different purpose and is used based on the nature of the data.
1. Mean (Arithmetic Average): The mean is the sum of all values in a dataset divided by the number of values. It is the most commonly used measure of central tendency.
The Mean can be divided into three types-
- Quartiles
- Percentiles, etc.
Applications of Mean
Used in business analytics to determine average sales, income, and expenditures.
Helps in research and education to analyze test scores and student performance.
Utilized in economics to calculate GDP per capita.
2. Median (Middle Value): The median is the middle value of an ordered dataset. If the dataset contains an even number of values, the median is the average of the two middle numbers.
Formula:
Arrange the data in ascending order.
If is odd, median = middle value.
If is even, median = average of the two middle values.
Example: For dataset 3, 7, 9, 12, 15, the median is 9 (middle value). For dataset 3, 7, 9, 12, 15, 18, the median is .
Applications of Median
Used in income distribution to analyze the median salary.
Helps in real estate to find median house prices.
Applied in medical research to determine the median survival time in clinical trials.
3. Mode (Most Frequent Value): The mode is the most frequently occurring value in a dataset. A dataset can be:
Unimodal (one mode)
Bimodal (two modes)
Multimodal (more than two modes)
Example: For dataset 2, 4, 4, 5, 6, 6, 6, 8, the mode is 6 because it appears most frequently.
Applications of Mode
Used in marketing to analyze the most preferred product size, color, or brand.
Helps in demographics to determine the most common age group in a population.
Useful in weather analysis to find the most frequent temperature range.
Comparison of Mean, Median, and Mode
| Measure | Best Used For | Affected by Outliers? | Data Type |
|---|---|---|---|
| Mean | Normally distributed data | Yes | Numerical |
| Median | Skewed distributions | No | Numerical |
| Mode | Categorical & discrete data | No | Categorical & Numerical |
Choosing the Right Measure of Central Tendency
Use Mean when the dataset has no extreme values and is symmetrically distributed.
Use Median when the dataset is skewed or has outliers.
Use Mode when analyzing categorical data or determining the most common value.
Properties of Central Tendency
The desired properties of a good measure are following,
- It should be based on all observations of an act of values.
- It should be rigorously defined.
- It should be easily computable.
- It should be least affected by extreme values.
- It should nucleate least from sample to sample drawn from the same population.
Advantages
Some advantages are following
- More precise measure than measures of dispersion.
- Easy to calculate.
- Less time consuming and lower cost.
Disadvantages
The measure of central tendency doesn’t work when outliers occur. That means this measure is affected by outliers.
Conclusion
Measures of central tendency—mean, median, and mode—are essential for understanding data patterns and making informed decisions. While the mean provides an overall average, the median helps with skewed data, and the mode is useful for identifying frequent occurrences. Knowing when to use each measure ensures accurate data interpretation and analysis in various fields, from finance to research and business. Understanding these concepts enhances the ability to summarize and analyze data effectively, leading to better decision-making and insights. Data Science