The sign test is the oldest of all non-parametric tests. and it is so called as usually covert the data for analysis to a series of plus and minus sign. The test statistic consists of either the number of plus sign or the number of minus sign. According to wikipedia, “The sign test is a statistical method to test for consistent differences between pairs of observations, such as the weight of subjects before and after treatment.”

Sign Test
Let, x1,x2,……… xn be a random sample of size n from a N population with mean μ.
Sign test for small sample case (n< 35)
Assumptions
- The population is continuous and symmetric about mean.
- xi’s are independent.
Hypothesis
We want to test the following hypothesis.

Test Procedure
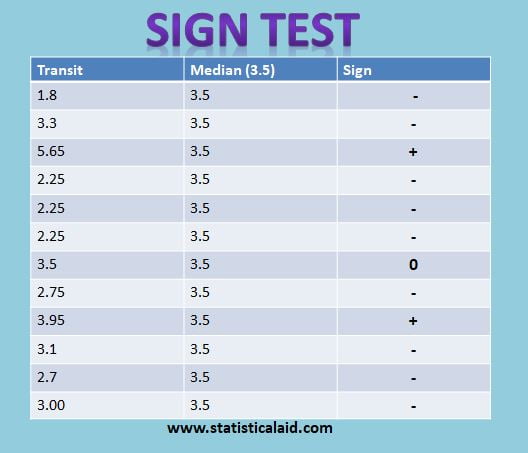
Since, the population is symmetric about μ. Then the probability of sample value exceeding the mean μ and the probability of a sample value less than μ are both 1/2 , get the difference, (xi-μ0); i=1,2,…,n. Put (t) sign if (xi-μ0) > 0 and minus sign if (xi-μ0) < 0 for some i. If, (xi-μ0)=0 then simply discard it from the analysis and n is reduced accordingly. Note that under H0, the number of plus sign is binomial variance with index n and parameter θ=1/2.

Conclusion: If the observed number of plus sign falls in the critical region, we may reject our Ho. otherwise we may accept ho.
Sign test for large sample (n>35)
For large sample H0 may be test by,
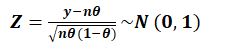
Where, z is approximately normally distributed with mean 0 and variance 1. The approximation to the normal distribution becomes better if a correction for continuity is used. The correction is necessary since the normal distribution is continuous while the normal distribution is involved discrete variable. The corrected 2 becomes.

Comment: If the calculated value of z falls in the critical region then we may reject our H0 otherwise accept our H0.
See other non-parametric Test: