
Statistical analysis plays a crucial role in data interpretation across various fields. While parametric tests are widely used, non-parametric tests provide a robust alternative when data assumptions are not met.
In statistics, Non-parametric tests test which does not make any assumption as to the form of distribution in the population from which the sample is drawn i.e. to say that the functional form of the distributions is not known. The test is called a non-parametric test or distribution-free test. In this guide, we will explore non-parametric tests, their advantages, types, and when to use them.
What Are Non-Parametric Tests?
Non-parametric tests are statistical tests that do not assume a specific distribution for the data. Unlike parametric tests, which require normal distribution and homogeneity of variance, non-parametric tests can be applied to ordinal, nominal, or non-normally distributed data.
Assumptions of Non-Parametric Tests
Non-parametric tests follow some assumptions. They are,
- Sample observations are independent
- The variable under study is continuous.
- The pdf is continuous.
- Lower order moment exists.
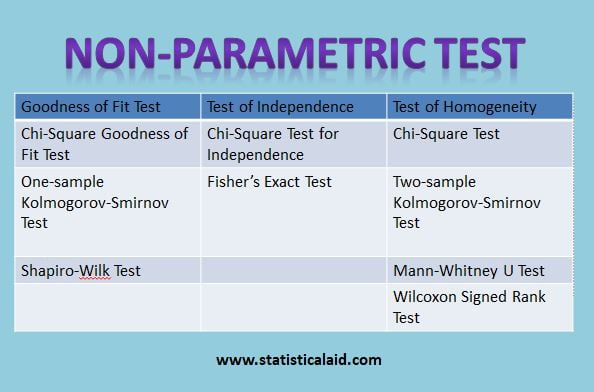
Common Non-Parametric Tests and Their Applications
1. Mann-Whitney U Test
The Mann–Whitney U test is a non-parametric alternative to the independent samples t-test. It is used to compare two independent groups when the assumption of normality is violated or when the data are ordinal. Instead of comparing means, it evaluates whether one group tends to have higher values than the other by ranking all observations together. The test calculates a U statistic based on the sum of ranks for each group. It is particularly useful for small sample sizes or skewed distributions. The null hypothesis states that the distributions of the two groups are equal. While it does not strictly test for differences in medians, it is often interpreted that way when the distributions have similar shapes. This test is widely applied in medical, social, and behavioral research.
2. Wilcoxon Signed-Rank Test
The Wilcoxon Signed-Rank test is a non-parametric alternative to the paired t-test. It is used when comparing two related samples, matched pairs, or repeated measurements on a single sample. The test assesses whether the median difference between paired observations is zero. It works by calculating the differences between pairs, ranking their absolute values, and assigning signs based on the direction of change. The test statistic is based on the sum of signed ranks. It assumes that the differences are symmetrically distributed around the median. This method is especially useful when the sample size is small or when data do not meet the assumptions of normality required for parametric tests. It is frequently used in before-and-after studies and clinical trials.
3. Kruskal-Wallis Test
The Kruskal–Wallis test is a non-parametric alternative to one-way ANOVA. It is used to compare three or more independent groups when the assumption of normality is not satisfied. The test ranks all observations across groups and then examines differences in the sum of ranks between groups. The null hypothesis states that all groups come from the same distribution. The test statistic follows an approximate chi-square distribution. While it identifies whether at least one group differs significantly, it does not specify which groups differ; post hoc tests are required for that. It is suitable for ordinal data or continuous data that are not normally distributed. This test is widely used in research fields such as biology, economics, and social sciences.
4. Friedman Test
The Friedman test is a non-parametric alternative to the repeated measures ANOVA. It is used to detect differences in treatments across multiple test attempts or conditions in related samples. The test ranks data within each block (or subject) and then compares the sum of ranks across treatments. The null hypothesis assumes that all treatments have the same effect. The test statistic follows a chi-square distribution. It is particularly useful when dealing with ordinal data or when the assumptions of parametric repeated measures ANOVA are violated. The Friedman test is commonly applied in experimental designs where the same subjects are exposed to different conditions, such as clinical trials or psychological experiments. Post hoc tests are required to determine which groups differ significantly.
5. Chi-Square Test
The chi-square test is a widely used non-parametric test for categorical data. It assesses whether there is a significant association between two categorical variables (Chi-square test of independence) or whether observed frequencies differ from expected frequencies (goodness-of-fit test). The test compares observed counts in each category with expected counts under the null hypothesis. The test statistic follows a chi-square distribution with appropriate degrees of freedom. It requires a sufficiently large sample size to ensure validity. This test does not provide information about the strength or direction of the relationship, only whether an association exists. It is extensively used in survey analysis, market research, and social science studies where data are presented in contingency tables.
Most used non-parametric Tests
There are some other tests which are generally used widely.
Advantages
There are some advantages of non-parametric test,
- Non-parametric methods are readily comprehensive very simple and easy to apply and do not require complicated sample theory.
- No assumption is made when the sample is drawn from the population.
- Non-parametric tests are available to deal with the data which are given in rank.
Disadvantages
- It can be used only if the measurements are nominal and ordinal even in that case if a parametric test exists it is more powerful than a non-parametric test.
- Non-parametric tests are designed to test statistical hypothesis only and not to estimate the parameter.
- A large number of different types of tables is required.
The steps for the testing procedure of Non-parametric test
1 : Hypothesis test: State the null hypothesis (Ho) and its alternative hypothesis (H1)
2: Statistical test: Among several tests that might be given research design, choose the test that most closely approximates the conditional research in terms of the assumptions the test is based.
3: Significance level: Specify a level of significance (α) and size (n )
4: Sampling distribution: finding the sampling distribution statistic test under the assumption that Ho.
5: Critical Region: Based on steps 2,3 and 4 above the region of rejection for the statistic form
6: Decision: If the value of the test statistic is one of rejection, the decision is to reject wise accept.
Difference between Parametric and Non-parametric test
Parametric Test | Non- Parametric Test |
Normality of the distribution | Non-normality of the distribution |
Scales of measurement are intervals. | Scales of measurement are ordinal and nominal. |
It depends upon on parameter of the population. | It does not depend on the parameter of the population. |
It is not always easy to apply. | Easy to apply and does not need complicated sample theory. |
It makes assumptions as to the form of distribution to the population. | It does not make assumptions as to the form of the distribution to the population. |
Here assumptions are too strict. | Here assumptions are less strict. Such: as continuity, discreteness, symmetry, etc. |
Here, Outlier exists. | Here, Outlier does not exist. |
The homogeneity of variance for the parametric test is,
![\[ \sigma _{1}^{2}=\sigma _{2}^{2}=...=\sigma _{n}^{2} \]](https://www.statisticalaid.com/wp-content/ql-cache/quicklatex.com-a78c622878802f6d7c3a21c3c753e0d6_l3.png "Rendered by QuickLaTeX.com")
The homogeneity of variance for non-parametric tests is,
![\[ \sigma _{1}^{2}\neq \sigma _{2}^{2}\neq ...\neq \sigma _{n}^{2} \]](https://www.statisticalaid.com/wp-content/ql-cache/quicklatex.com-5515d1bbb11fa92cc74908e0b2fe868f_l3.png "Rendered by QuickLaTeX.com")
When to Use Non-Parametric Tests
- When data does not follow a normal distribution.
- When dealing with small sample sizes.
- When using ordinal or categorical data.
- When variance assumptions of parametric tests are violated.
Limitations
- Less statistical power compared to parametric tests.
- May not provide precise estimates of population parameters.
- More challenging to interpret results.
Conclusion
Non-parametric tests are essential tools for statistical analysis, especially when data does not meet parametric assumptions. Understanding their applications and limitations allows researchers to make informed decisions when analyzing data. Whether working with small sample sizes, ordinal data, or non-normally distributed variables, non-parametric tests provide a reliable alternative for drawing meaningful conclusions.
For more insights on statistical analysis, stay updated with our latest content! Data Science Blog