Uniform distribution is a fundamental concept in probability theory and statistics. It represents a scenario where all outcomes are equally likely, making it an essential tool in data analysis, simulations, and real-world applications.
It is used in statistics to describe a type of probability distribution in which every conceivable outcome has an equal chance of occurring. Because each variable has an equal chance of being the outcome, the probability is constant. In this article, we will explore uniform distribution, its types, properties, formulas, and applications, making it easy for both beginners and professionals to grasp.

What is Uniform Distribution?
Uniform distribution refers to a probability distribution where all values have an equal chance of occurring. This distribution is divided into two main types:
Continuous Uniform Distribution – Deals with an infinite number of possible values within a given range.
Discrete Uniform Distribution – Deals with a finite number of outcomes.
Discrete Uniform Distribution
A discrete uniform distribution is a statistical distribution with limited values and equal probability of outcomes in statistics and probability theory. The multiple results of rolling a 6-sided die are a nice example. 1, 2, 3, 4, 5, or 6 are examples of possible values. Each of the six numbers has an equal chance of occurring in this situation.
As a result, each side of the 6-sided die has a 1/6 probability each time it is thrown. The total number of possible values is limited. When rolling a fair die, it is impossible to acquire a value of 1.3, 4.2, or 5.7. When a second die is added and both are thrown, the resulting distribution is no longer uniform because the probability of the sums is not equal. The probability distribution of a coin flip is another simple example. There can only be two conceivable outcomes in such a circumstance. As a result, the finite value is two.
In Monte Carlo simulation, a discrete uniform distribution is also helpful. This is a modeling technique that employs computer technology to determine the likelihood of various events. Monte Carlo simulation is frequently used to estimate future events and identify dangers.
Continuous Uniform Distribution
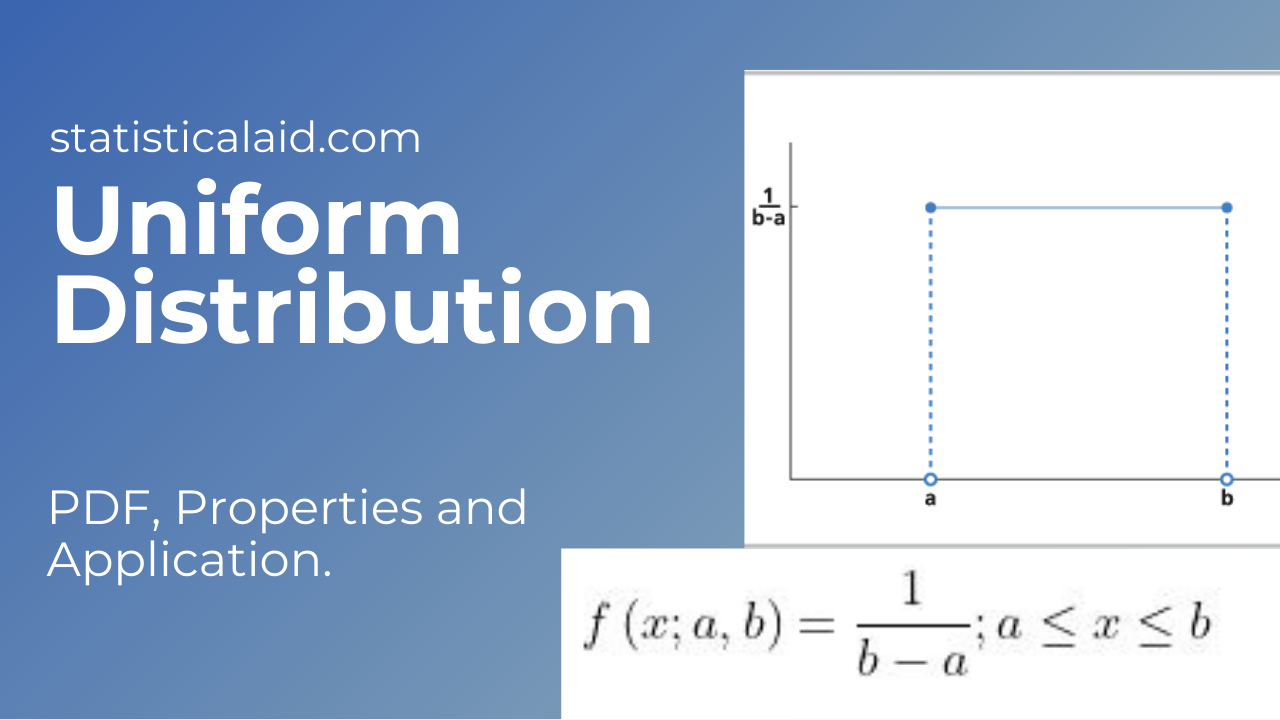
A statistical distribution with an infinite number of equally likely measurable values is known as a continuous uniform distribution (sometimes known as a rectangle distribution). A continuous random variable, unlike discrete random variables, can take any real value within a given range. A rectangular shape is typical for a continuous uniform distribution. An idealized random number generator is a nice example of a continuous uniform distribution. Every variable has an equal chance of occurring in a continuous uniform distribution, just as it does in a discrete uniform distribution. However, there are an endless number of possible points.
![]()
History/Origin

Properties
Special characteristics
There are some special characteristics-
- The probability of uniform distribution depends on the length of the intervals, not on its position.
- The uniform distribution’s PDF over the interval [0,1] is f(x) = 1.
- Moreover, there are infinitely many ways to define a uniform distribution.
Uniform Vs. Normal Distribution
Probability distributions assist you in determining the likelihood of a future event. Discrete uniform, binomial, continuous uniform, normal, and exponential are some of the most frequent probability distributions. The normal distribution, commonly shown as a bell curve, is one of the most well-known and widely used. It depicts the distribution of continuous data, showing that most data points cluster around the mean or average. In a normal distribution, the area under the curve equals one, and 68.27% of all data falls within one standard deviation of the mean; 95.45% of all data falls within two standard deviations of the mean; and about 99.73 percent of all data falls within three standard deviations of the mean. The frequency of data happening reduces as the data travels away from the mean
Applications
Uniform distribution plays a vital role in various domains, including:
- Computer Simulations – Used in random number generation for Monte Carlo simulations.
- Quality Control – Helps in equal probability testing of samples.
- Gaming Industry – Ensures fair play in games like rolling dice or shuffling cards.
- Traffic Engineering – Models vehicle arrivals in certain traffic scenarios.
Conclusion
Uniform distribution is a simple yet powerful concept in probability and statistics. Whether dealing with discrete or continuous cases, understanding its properties and applications can provide valuable insights into data analysis and decision-making processes. By applying its principles, industries can ensure fairness, randomness, and efficiency in their respective fields.
FAQs
Q1: What is an example of a uniform distribution?
-A fair coin toss, where the probability of heads or tails is 50%, is an example of a discrete UD.
Q2: How is it different from normal distribution?
-Uniform distribution has constant probability across its range, whereas normal distribution follows a bell-shaped curve with higher probabilities near the mean.
Q3: How does machine learning use uniform distribution?
-It helps sample data, randomly initialize weights in neural networks, and power various simulation-based models.
Understanding uniform distribution enhances data-driven decision-making, making it a crucial concept in statistics and probability theory.

 .
.  .
. .
.