
A power series distribution is a discrete probability distribution that applies to a subset of natural numbers. The distribution’s names derive from the fact that the power series is used to construct them. This broad category of distributions includes a number of discrete distributions, such as the Poisson distribution, negative binomial distribution, and binomial distribution.
In statistics, the Power Series Distribution refers to a family of probability distributions that are governed by a power series function. This distribution is particularly useful when modeling random variables that exhibit a varying level of dispersion. Power series distributions are widely applied in areas such as genetics, actuarial science, economics, and reliability analysis due to their flexibility in fitting diverse datasets.
This article will delve into the concept of power series distributions, their properties, and their applications in various statistical contexts.
Understanding the Power Series Distribution
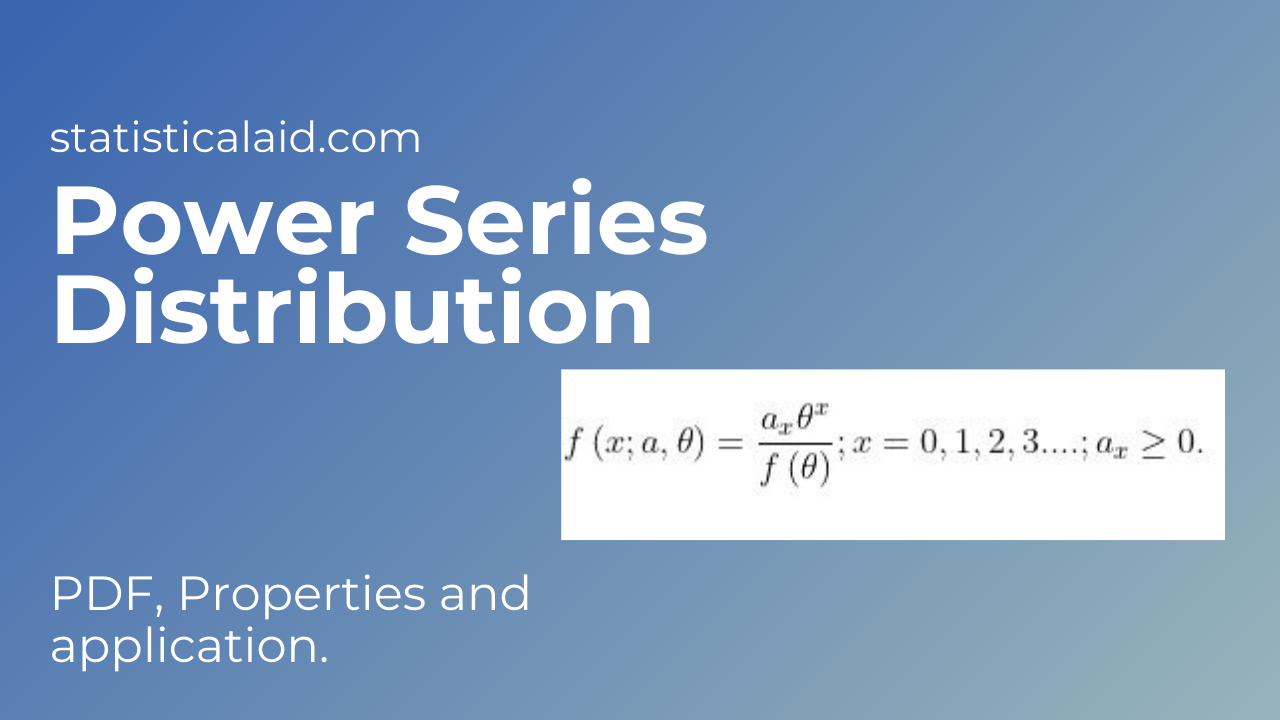
![\[ f\left (x;a,\theta \right )=\frac{a_{x}\theta ^{x}}{f(\theta )}; x=0,1,2,3,...;a_{x}\geq 0 \]](https://www.statisticalaid.com/wp-content/ql-cache/quicklatex.com-dae6dccb63ca16c809c43c0cbf592e17_l3.png "Rendered by QuickLaTeX.com")
Key Features of Power Series Distribution
- Flexibility: Power series distributions can accommodate various shapes of data, including skewed, heavy-tailed, or symmetric distributions.
- Parameterization: The distribution is parameterized by a series of coefficients, which makes it versatile in modeling different types of data.
- Generality: This distribution includes several well-known distributions as special cases. For example, the Poisson Distribution can be seen as a particular case of a Power Series Distribution.
Properties
1. Mean and Variance: The mean and variance of a Power Series Distribution depend on the specific form of the distribution. For many distributions, these moments can be expressed in terms of the parameters of the distribution.
- Mean: The expected value of X, E[X], often depends on the parameter α\alphaα.
- Variance: The variance of X, Var(X), can also be derived using the moments of the distribution.
2. Over-dispersion: One important property of Power Series Distributions is their ability to model over-dispersion, where the variance of the distribution exceeds the mean. This is in contrast to distributions like the Poisson distribution, where the mean and variance are equal.
3. Skewness and Kurtosis: The shape of the distribution (e.g., skewness and kurtosis) can be controlled by adjusting the parameter α\alphaα. Power Series distributions are versatile in this regard, making them suitable for modeling a wide range of data with varying levels of skewness or fat tails.
- If θ=p/(1-p), f(θ)=(1+θ)^n and s={1,2,3,…,n), a set of (n+1) non-negative integers then the power series distribution is tends to binomial distribution.
- If f(θ)=e^θ and s={0,1,2,3,…,∞} then the distribution tends to poisson distribution.
- If θ=p/(1-p), f(θ)=(1+θ)^-n and s={0,1,2,3,…,∞), then the power series distribution tends to negative binomial distribution.
- If f(θ)=-log(1-θ) and s={1,2,….}, then the power series distribution tends to logarthmic distribution.
Examples of Power Series Distributions
Several well-known distributions can be classified under the umbrella of Power Series distributions, each with its own specific applications. These include:
1. Poisson Distribution: The Poisson distribution is one of the most commonly used distributions in statistics, especially for modeling rare events in a fixed interval of time or space. It can be seen as a Power Series Distribution with the parameter α=λ, where λ is the expected number of events.
2. Negative Binomial Distribution: The Negative Binomial Distribution, which generalizes the geometric distribution, can also be viewed as a Power Series Distribution. It is frequently used to model count data, such as the number of trials until a certain number of successes are achieved in a series of independent and identically distributed trials.
3. Geometric Distribution: The Geometric Distribution, which is a special case of the Negative Binomial, can also be derived from a Power Series. It models the number of trials required to achieve the first success in a series of Bernoulli trials.
Power Series Distribution to others distribution…
| Power Series Tends to- | Condition |
| Binomial distribution | If θ = p / (1 – p); f(θ) = (1 + θ)n; s = {1, 2, 3, … n} |
| Poisson Distribution | If f(θ) = eθ and s = {0, 1, 2, 3, … ∞} |
| Negative Binomial Distribution | If θ = p / (1 – p); f(θ) = (1 + θ)-n; s = {0, 1, 2, 3, … ∞} |
| Logarithmic distribution | If f(θ) = -log (1 – θ) and s = {1, 2, …}, |
Estimation and Fitting
To estimate the parameters of a Power Series Distribution from data, techniques such as Maximum Likelihood Estimation (MLE) or Method of Moments are often employed. Fitting these distributions to data involves finding the parameter values that maximize the likelihood of observing the given data or match the sample moments.
Maximum Likelihood Estimation (MLE)
MLE is a widely used technique for parameter estimation, where the goal is to maximize the likelihood function. In the context of Power Series distributions, MLE helps determine the most likely parameter values given observed data.
Applications of Power Series Distribution
1. Modeling Rare Events: Power Series distributions are particularly effective in modeling rare events or count data that follow an over-dispersed Poisson process. For instance, in genetics, these distributions can model the occurrence of rare mutations in a population over time.
2. Actuarial Science: In actuarial science, Power Series distributions are used to model the frequency of insurance claims and other related risk factors. By using this distribution, actuaries can better assess the risk of extreme outcomes, such as catastrophic events.
3. Econometrics: Economists and statisticians apply Power Series distributions in econometrics for the analysis of financial data, where the variability of outcomes can be quite high. These distributions help in estimating the likelihood of different economic events occurring.
4. Reliability Analysis: Power Series distributions are valuable tools in reliability engineering. They model the time until failure of products, systems, or components. Since many real-world systems exhibit non-exponential failure rates, using Power Series distributions offers more realistic models.
Conclusion
The Power Series Distribution in statistics is a versatile and powerful tool for modeling a wide range of data types, particularly in cases of over-dispersed count data or rare events. With its ability to adapt to various shapes of data, it serves as a crucial distribution in fields such as actuarial science, econometrics, genetics, and reliability analysis.
By understanding the properties and applications of Power Series distributions, statisticians can more accurately model and predict complex datasets. Whether it’s dealing with rare events, economic models, or reliability engineering, the flexibility of Power Series distributions makes them a valuable addition to the statistical toolkit. Data Science Blog