Statistical analysis is essential for making informed decisions based on data. Among the many statistical tests available, the paired sample t-test (also known as the dependent sample t-test or repeated measures t-test) is a powerful and commonly applied method. It plays a critical role when you want to compare two related groups or measurements to see if there is a statistically significant difference between them.
In this guide, we will explore everything you need to know about the paired sample t-test—what it is, when and how to use it, the underlying assumptions, step-by-step calculations, examples, and practical applications. Plus, we’ll include a detailed conclusion and a Q&A section to clarify common questions.
What Is a Paired Sample t-Test?
The paired sample t-test is designed to compare the means of two related groups to determine whether there is a statistically significant difference between these means.
But what does “paired” or “related” mean?
Paired samples occur when the observations in one sample are linked to observations in the other sample. The most common example is before-and-after measurements on the same subjects, but it can also involve matched subjects or pairs.
Examples of Paired Samples
- Measuring the blood pressure of patients before and after a treatment.
- Testing the reading ability of children before and after a specialized training program.
- Comparing test scores of students on two different exams where the same students took both.
In these cases, the two sets of data are not independent because they involve measurements from the same individuals or matched pairs.
Why Use a Paired Sample t-Test?
When comparing two groups, you might be tempted to use an independent two-sample t-test. However, if the data are paired or related, the independent test is inappropriate because it ignores the correlation between observations.
The paired sample t-test accounts for this by analyzing the differences between paired observations, thus controlling for individual variability. This often increases the statistical power of the test.
The Hypotheses in a Paired t-Test
The paired t-test examines whether the mean difference between paired observations is significantly different from zero (or some other hypothesized value).
For each pair, define the difference: di = X1i−X2i
Where X1i and X2i are the paired measurements for subject i.
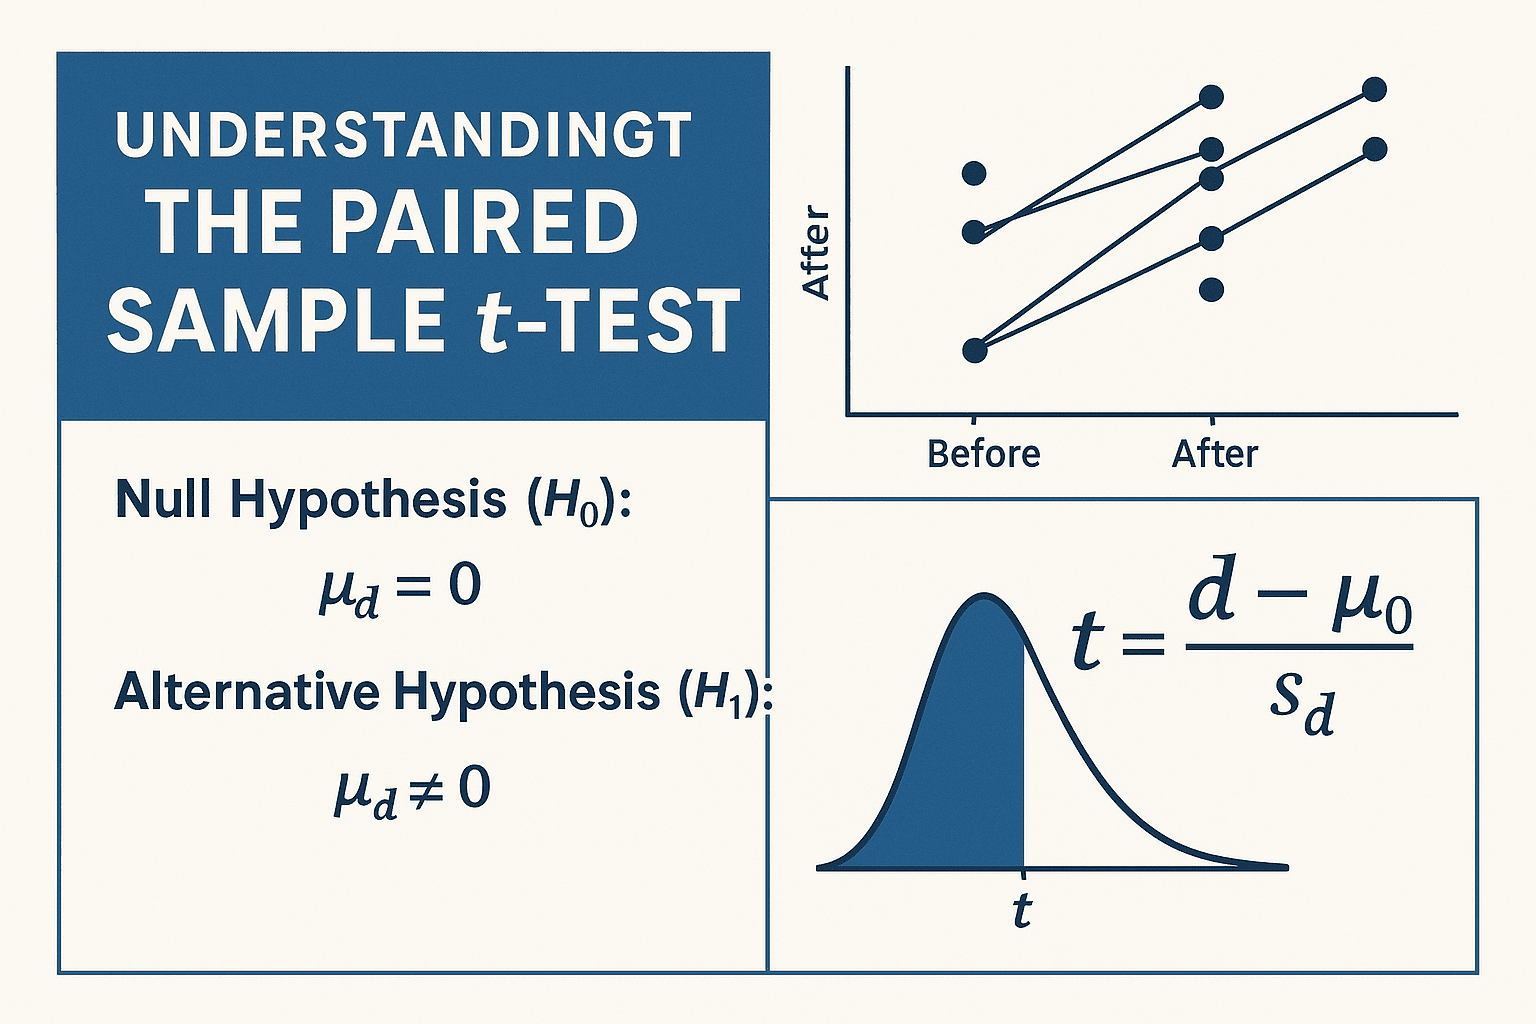
- Null Hypothesis (H₀): The mean difference is zero.
H0: μd=0
- Alternative Hypothesis (H₁): The mean difference is not zero (two-tailed test); or less/greater than zero if one-tailed.
H1: μd ≠ 0 or μd>0 or μd<0
Assumptions of the Paired Sample t-Test
For valid results, several assumptions should hold:
- Paired Observations: The data must consist of matched pairs or repeated measures.
- Continuous Data: The dependent variable should be measured on an interval or ratio scale.
- Independence of Differences: The differences between pairs should be independent of one another.
- Normality of Differences: The distribution of the differences did_idi should be approximately normal. For larger samples (n>30), the test is robust to violations of this assumption.
Paired Sample t-Test Formula
The paired t-test calculates a t-statistic from the differences:

Where:
- d bar = sample mean of the differences
- sd = standard deviation of the differences
- n = number of pairs
- μ0 = hypothesized mean difference (often 0)
The degrees of freedom: df = n−1
Step-by-Step Procedure for the Paired t-Test
1. Collect Your Data
Gather paired observations: before and after data, or two related measures for each subject.
2. Calculate Differences for Each Pair
For each pair i, calculate: di=X1i−X2i
3. Compute the Mean and Standard Deviation of the Differences


4. Calculate the t-Statistic
Usually, μ0=0
5. Determine Degrees of Freedom
df = n−1
6. Find the Critical t-Value or p-Value
Consult a t-distribution table or use statistical software to find the critical value or exact p-value for the calculated ttt with dfdfdf degrees of freedom at your chosen significance level (e.g., α=0.05).
7. Make Your Decision
- If |t| exceeds the critical t-value or p<α, reject the null hypothesis.
- Otherwise, fail to reject the null hypothesis.
Example: Paired Sample t-Test in Action
Suppose a nutritionist wants to test if a new diet impacts the cholesterol level of patients. The cholesterol levels (in mg/dL) for 8 patients are measured before and after 6 weeks on the diet:
| Subject | Before | After |
|---|---|---|
| 1 | 230 | 210 |
| 2 | 250 | 240 |
| 3 | 225 | 215 |
| 4 | 210 | 200 |
| 5 | 260 | 230 |
| 6 | 240 | 220 |
| 7 | 235 | 225 |
| 8 | 220 | 205 |
Step 1: Calculate Differences (Before – After)
| Subject | Difference did_idi |
|---|---|
| 1 | 20 |
| 2 | 10 |
| 3 | 10 |
| 4 | 10 |
| 5 | 30 |
| 6 | 20 |
| 7 | 10 |
| 8 | 15 |
Step 2: Calculate Mean and Standard Deviation of Differences
Calculate the mean difference:

Now calculate standard deviation sd:
Step 1: Calculate each-

| di | di−d_bar | (di−d_bar)^2 |
|---|---|---|
| 20 | 4.375 | 19.14 |
| 10 | -5.625 | 31.64 |
| 10 | -5.625 | 31.64 |
| 10 | -5.625 | 31.64 |
| 30 | 14.375 | 206.64 |
| 20 | 4.375 | 19.14 |
| 10 | -5.625 | 31.64 |
| 15 | -0.625 | 0.39 |
Sum of squared differences:19.14+31.64+31.64+31.64+206.64+19.14+31.64+0.39=371.87
Calculate standard deviation:

Step 3: Calculate the t-statistic

Step 4: Degrees of Freedom
df=8−1=7
Step 5: Make a Decision
Looking up a t-table for 7 degrees of freedom at α=0.05 (two-tailed), the critical value is approximately 2.365.
Since 6.06>2.365, we reject the null hypothesis and conclude that the diet significantly changes cholesterol levels.
Advantages of the Paired Sample t-Test
- Controls for Subject-Specific Variability: Because comparisons are within-subject, external confounding variables are minimized.
- Greater Statistical Power: Requires fewer subjects than independent sample tests to achieve the same power.
- Simple and Common: Intuitive and widely supported by statistical software and spreadsheets.
Limitations and Considerations
- Requires Paired Data: You need paired or matched observations; cannot be used for independent groups.
- Sensitive to Outliers: Extreme values in differences can distort results.
- Normality of Differences: Important especially with small sample sizes.
- Not Suitable for Nominal or Ordinal Data: Requires continuous numeric data.
Practical Applications of the Paired Sample t-Test
- Medical Studies: Testing treatment effects by comparing patients before and after an intervention.
- Psychology: Measuring cognitive scores under two conditions on the same subjects.
- Education: Assessing test improvements pre- and post-instruction.
- Manufacturing: Evaluating measurements from instruments before and after calibration.
Conducting the Paired t-Test Using Software
Most statistical software packages and even spreadsheet applications provide easy tools for paired sample t-tests:
- Excel: Use the “Data Analysis” toolpak > t-Test: Paired Two Sample for Means.
- R:
t.test(x, y, paired = TRUE) - Python (scipy):
scipy.stats.ttest_rel(x, y) - SPSS: Analyze > Compare Means > Paired-Samples T Test
These tools automatically compute the t-statistic, p-value, and often provide confidence intervals.
Conclusion
The paired sample t-test is a fundamental statistical tool for comparing two related groups or repeated measurements on the same subjects. Its focus on the differences within pairs makes it particularly powerful where variability between subjects might otherwise cloud the results.
By understanding the paired t-test’s assumptions, computation, and interpretation, analysts and researchers can more accurately detect real changes or effects in paired data scenarios.
In practical terms, this test is widely used across medicine, psychology, education, and many other fields to evaluate interventions, treatment effects, and time-dependent changes within the same group, offering insight into the true impact of an experimental condition. Data Science Blog
Frequently Asked Questions (Q&A)
1. Can I use the paired t-test if the sample size is small?
Yes, but be cautious. The assumption that the differences are normally distributed is more critical for small samples. If normality is questionable, consider a non-parametric alternative like the Wilcoxon signed-rank test.
2. What if the data are not paired or matched?
If samples are independent, you should use an independent two-sample t-test, not a paired t-test.
3. Can the paired t-test be one-tailed?
Yes. If you have a rational expectation of the direction of the effect (e.g., you predict an increase), you can use a one-tailed test.
4. How does the paired t-test handle missing data?
Pairs with missing values in either measurement are usually excluded from analysis, reducing sample size and potentially power.
5. What is the difference between a paired t-test and repeated measures ANOVA?
The paired t-test compares two related means, while repeated measures ANOVA handles more than two related groups/conditions.
6. Are paired t-tests robust to violations of assumptions?
They are generally robust to mild violations of normality with large samples, but with small or skewed samples, the results may be unreliable.
7. Can I calculate a confidence interval for the mean difference?
Absolutely. The confidence interval is:

It provides a range of plausible values for the true mean difference.
8. What if the differences are zero for many pairs?
If many differences are exactly zero, it may indicate little change between measurements, but you should check for possible data recording errors or reconsider analysis methods.