When someone says “average,” what’s the first thing that comes to mind? For most of us, it’s the simple act of adding up a bunch of numbers and dividing by how many numbers there are. That intuitive process is exactly what we call the Arithmetic Mean, and it’s by far the most common and fundamental type of average used across every field, from finance to sports to everyday conversations.
But while it’s ubiquitous, truly understanding the arithmetic mean – its strengths, weaknesses, and when to use it effectively – is crucial for making sense of data. Let’s dive in and unpack this cornerstone of statistics.

What Exactly is the Arithmetic Mean?
In simple terms, the arithmetic mean is the sum of all values in a dataset divided by the number of values in that dataset. It represents the “typical” or “central” value, as if you were to distribute the total quantity equally among all observations.
Imagine you have a group of friends, and you’re trying to figure out the “average” amount of money they have in their wallets. You’d ask each friend, add all their cash together, and then divide by the number of friends. The result is the arithmetic mean – the amount each friend would have if the total cash were distributed evenly.
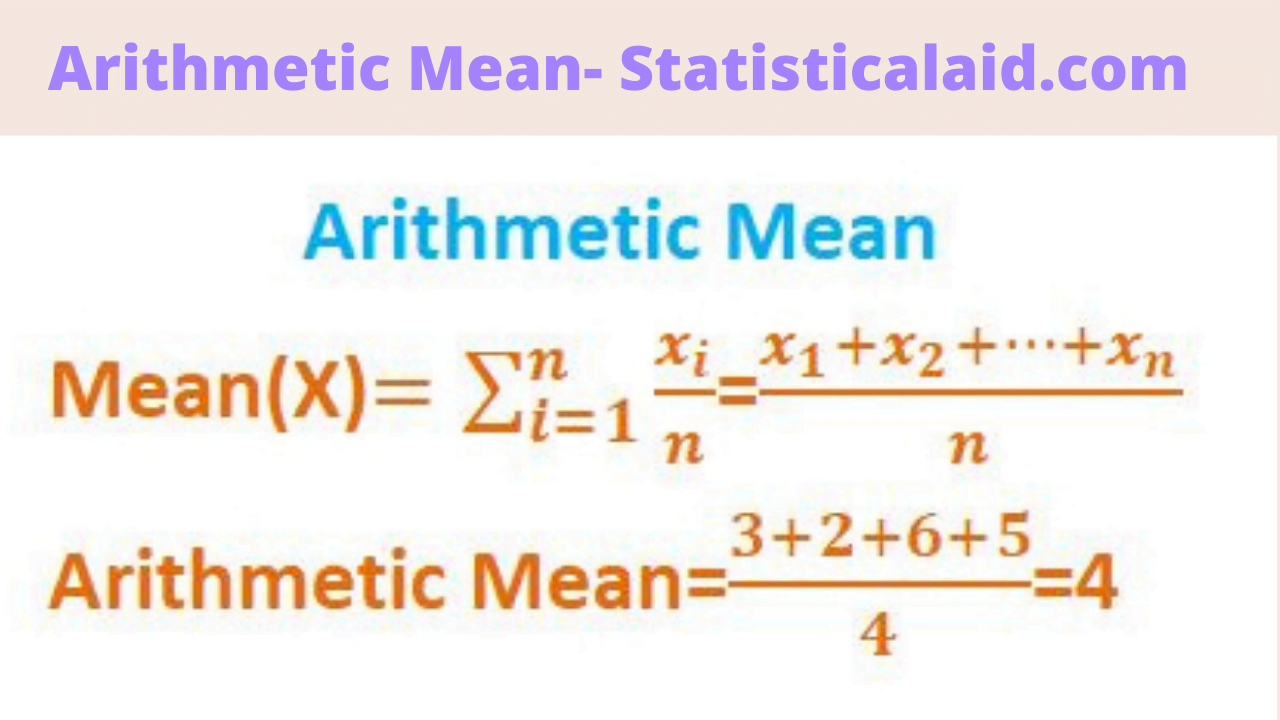
The arithmetic mean of a set of data may be defined as the sum of the values divided by the number of values in the set. Its formula is,

Where , A= Arithmetic mean
n= number of observations
i= 1,2,3,4,…,n.
More precisely, we can say that the arithmetic mean is the average or central value of observations obtained by summing the observations and dividing them by the number of observations. This is the simplest measure of the measure of central tendency. We conduct the arithmetic mean of numerical statistical data, whichis are representative sample of a population.
Example: Let’s say a student has the following scores on five quizzes: 85, 92, 78, 95, 80. To find the average (arithmetic mean) score:
- Sum the scores: 85+92+78+95+80=430
- Count the number of scores: There are 5 scores.
- Divide the sum by the count: 430/5=86
So, the arithmetic mean of the student’s quiz scores is 86.
Key Properties of the Arithmetic Mean
The arithmetic mean has several important mathematical properties that define its behavior:
- Uniqueness: For any given dataset, there is only one arithmetic mean. It’s a precise single value.
- Sum of Deviations is Zero: If you subtract the mean from every value in the dataset and then sum up those differences, the result will always be zero. This illustrates that the mean is a balancing point in the data.
- (85-86) + (92-86) + (78-86) + (95-86) + (80-86)
- (-1) + (6) + (-8) + (9) + (-6) = 0
- Sensitivity to Extreme Values (Outliers): This is perhaps its most crucial characteristic. The mean is highly influenced by unusually high or low values (outliers). Just one extreme number can significantly pull the mean away from the true “center” of the majority of the data.
- Central Tendency: It’s one of the primary measures of central tendency, aiming to give you a sense of where the “middle” or “typical” value of your data lies.
- Mathematical Operability: The mean can be used in further algebraic computations and statistical formulas, forming the basis for more advanced analyses like variance, standard deviation, and regression.
Advantages (Pros) of the Arithmetic Mean
- Easy to Understand and Compute: Its calculation is intuitive and straightforward.
- Uses All Data Points: Unlike the median (which only considers the middle value) or the mode (which focuses on frequency), the mean incorporates the value of every single data point in its calculation.
- Unique Value: For any given dataset, there’s only one arithmetic mean, providing a clear and unambiguous measure.
- Foundation for Advanced Statistics: It’s a building block for many other sophisticated statistical techniques.
Disadvantages (Cons) of the Arithmetic Mean
- High Sensitivity to Outliers: This is its most significant drawback. If your dataset contains extreme values, the mean can become unrepresentative of the typical value.
- Example: If Bill Gates walks into a room of 9 average people, the average net worth of the room instantly skyrockets, but it doesn’t reflect the typical person’s wealth in that room.
- Misleading for Skewed Distributions: In datasets where data is heavily skewed (e.g., income distribution where a few people earn a lot more than the majority), the mean can be pulled towards the tail, giving a distorted picture of the typical value.
- Not Suitable for Qualitative/Categorical Data: You cannot calculate an arithmetic mean for non-numeric data (e.g., average hair color, average favorite fruit).
- Can Be Meaningless for Discrete Data: For variables that must be whole numbers (like the number of children per family), an average like “2.3 children” doesn’t represent any actual family size.
- Ignores Data Distribution: The mean only tells you the central point; it doesn’t convey anything about the spread or shape of the data. Two very different datasets can have the same mean.
When to Use the Arithmetic Mean (and When Not To)
Use the Arithmetic Mean When:
- Your data is symmetrically distributed (e.g., normally distributed or bell-shaped).
- There are no significant outliers in your data.
- You need a measure that incorporates the value of every single data point.
- You plan to perform further statistical analyses that require the mean (like standard deviation).
Avoid the Arithmetic Mean When:
- Your data is highly skewed (e.g., income, house prices).
- Your data contains extreme outliers that would distort the average.
- You are dealing with qualitative or categorical data.
- You need the “middle value” that isn’t affected by extremes (in which case, consider the Median).
- You need the “most frequent value” (in which case, consider the Mode).
For the above demerits, we use geometric mean and harmonic mean instead of arithmetic mean. If the measure of central tendency fails to describe the data, then we use measures of dispersion.
Mean vs. Median vs. Mode: A Quick Distinction
- Arithmetic Mean: The sum of values divided by the count. Best for symmetrical data without outliers.
- Median: The middle value in an ordered dataset. Robust to outliers and skewed data, representing the true “middle.”
- Mode: The most frequently occurring value in a dataset. Useful for categorical data and identifying common categories.
Conclusion
The arithmetic mean is a powerful and intuitive statistical tool, ingrained in how we process and discuss data. It provides a simple, single number that summarizes the central tendency of a dataset. However, its simplicity can also be its weakness. A responsible analyst, student, or even a casual observer of statistics must understand not just how to calculate the mean, but also its inherent properties and, critically, its limitations. Data Science Blog