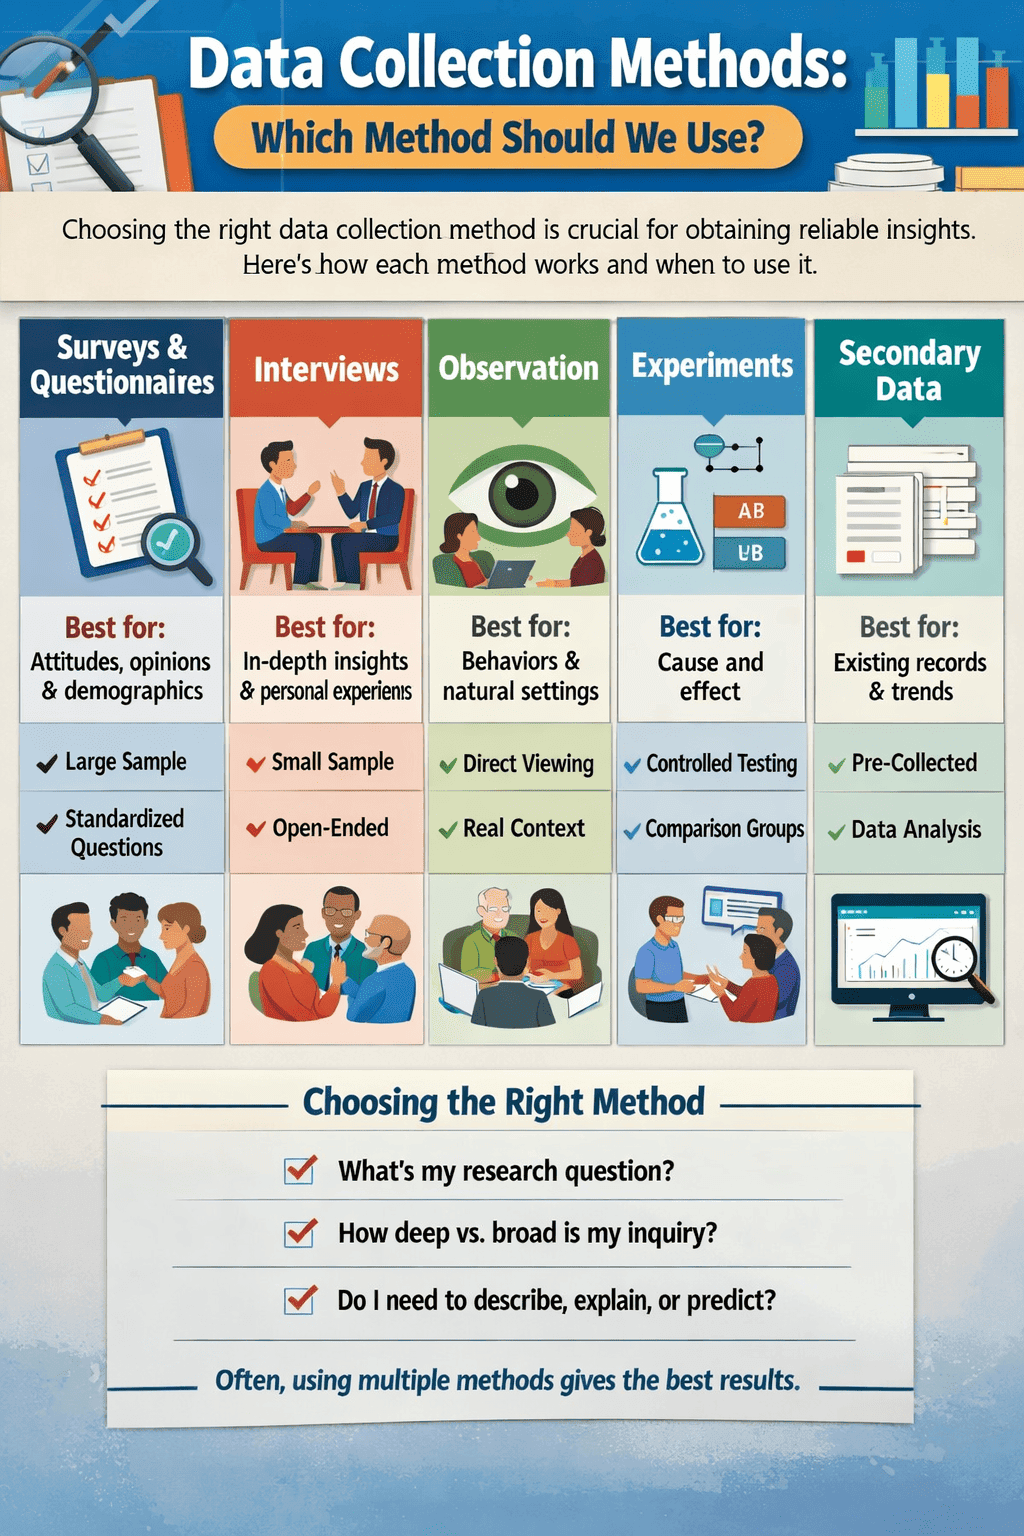
Every insight begins with data. Whether you’re a researcher studying human behavior, a business analyst tracking customer trends, or a scientist measuring climate variables, the way you collect data determines the quality of every conclusion that follows. Choose the wrong method and you risk biased results, wasted resources, and decisions built on shaky ground. So, choosing the right data collection method is crucial for obtaining reliable insights.
This guide walks you through the most important data collection methods used today explaining what each one is, when to use it, and exactly how to apply it step by step. By the end, you’ll know not just what these methods are, but why they work and how to choose between them.
What Is Data Collection Method?
Data collection is the systematic process of gathering and measuring information from various sources to answer research questions, test hypotheses, or solve real-world problems. It is the foundation of evidence-based decision-making in every field from medicine and social science to marketing and engineering.
Good data collection is intentional. It starts with a clear question, selects a method appropriate to that question, and follows a consistent protocol to ensure the data is valid (it measures what it claims to measure) and reliable (you would get the same results if you repeated the process under the same conditions).
There are two broad families of data: qualitative data, which captures descriptions, meanings, and experiences (words, categories, themes), and quantitative data, which captures numbers and measurements. Most methods can produce one or both types, and the best research projects often combine them.
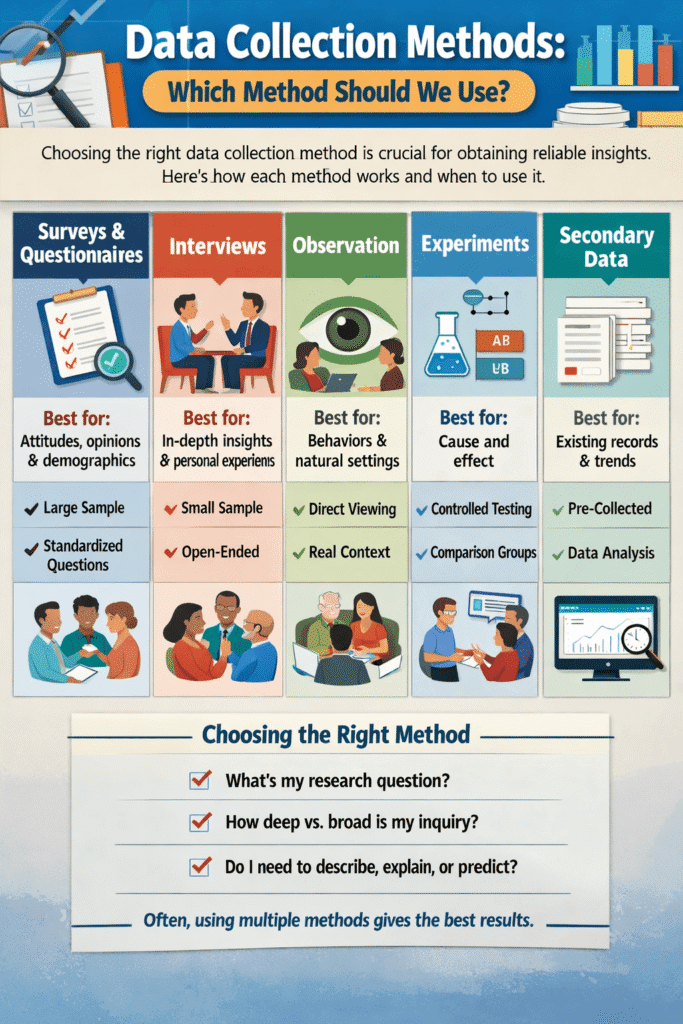
Method 1: Surveys & Questionnaires
Surveys are one of the most widely used data collection tools because they allow researchers to gather standardized information from large numbers of people efficiently. A survey presents a fixed set of questions to respondents, either on paper, online, by phone, or in person.
Best for: measuring attitudes, opinions, behaviors, and demographics across a large sample.
- Define your research objective. Know exactly what you’re trying to measure. Are you studying customer satisfaction? Political opinions? Health behaviors? A vague objective produces vague questions.
- Identify your target population. Decide who should answer: all adults, customers who purchased in the last 6 months, students at a specific university, etc.
- Choose your question types. Use closed-ended questions (multiple choice, Likert scale, yes/no) for quantitative data; open-ended questions for qualitative insights.
- Write and pilot your questions. Avoid leading questions, double-barreled questions, and jargon. Test the survey with a small group first to catch confusing wording.
- Select your distribution channel. Online tools (Google Forms, Typeform, SurveyMonkey) work well for large digital audiences. Phone or mail surveys reach different demographics.
- Collect and clean responses. Remove incomplete or duplicate entries. Check for response patterns that suggest random answering (straight-lining).
- Analyze and interpret. Use descriptive statistics for closed-ended questions; thematic coding for open-ended responses.
Real-World Example
A retail company wants to measure post-purchase satisfaction. They send a 5-question email survey to 10,000 customers one week after delivery, using a 1–5 Likert scale for satisfaction and one open-ended question: “What could we do better?” They achieve a 12% response rate, giving them 1,200 usable responses enough to identify that slow delivery is the most common complaint.
Method 2: Interviews
Interviews go deeper than surveys. Rather than choosing from pre-set answers, respondents speak freely and the interviewer can follow up, probe, and clarify. This makes interviews ideal when you need to understand the why behind behavior or explore complex, sensitive, or nuanced topics.
Best for: exploring lived experiences, expert knowledge, and motivations in depth.
- Choose your interview structure. Structured interviews use a fixed script (more consistent, easier to compare). Semi-structured interviews use a guide but allow flexibility. Unstructured interviews are open-ended conversations best for early exploration.
- Sample your participants purposefully. Unlike surveys, interviews use small samples (typically 5–30 people). Select participants who have direct experience with the phenomenon you’re studying.
- Prepare an interview guide. Write 8–15 core questions that are open-ended and non-leading. Arrange them to build rapport first, then move toward deeper topics.
- Conduct the interview. Record with consent. Listen actively. Use probes like “Can you tell me more about that?” or “What do you mean by…?” to go deeper.
- Transcribe and analyze. Convert audio to text, then code themes. Qualitative analysis tools like NVivo can help, but careful manual reading is irreplaceable.
Real-World Example
A hospital is redesigning its emergency intake process. Rather than just surveying patients, researchers conduct 20 semi-structured interviews with recent ER visitors, asking about their experience from arrival to discharge. The interviews reveal an unexpected insight: patients feel most anxious during the silent waiting period when no one updates them on wait times a problem a satisfaction survey score would have missed entirely.
Method 3: Observation
Observation involves watching subjects in their natural or controlled environment and recording what actually happens rather than asking them to describe or recall their own behavior. This eliminates the gap between what people say they do and what they actually do, which can be surprisingly large.
Best for: studying behaviors, interactions, and processes in their natural context.
- Choose your observation role. As a non-participant observer, you watch without getting involved. As a participant observer (common in ethnographic research), you join the group you’re studying, building deeper contextual understanding.
- Decide between covert and overt observation. Overt observation (where subjects know they’re being watched) can alter behavior (the Hawthorne effect). Covert observation avoids this but raises ethical questions.
- Develop an observation protocol. Define exactly what behaviors to record, how to record them (tally sheets, field notes, video), and at what time intervals.
- Conduct observations systematically. Stick to your protocol. Record everything during observation; avoid inferring meaning until analysis.
- Analyze field notes and recordings. Look for patterns, anomalies, and recurring behaviors. Compare across different observation sessions or sites.
Real-World Example
A UX research team wants to improve a mobile banking app. Rather than asking users how they use the app, they recruit 10 participants and use screen-recording software to observe real sessions. They discover that 7 out of 10 users struggle to find the “transfer money” feature within the first 30 seconds a usability failure that no amount of survey data had flagged, because users assumed the difficulty was their own fault and rated the app highly anyway.
Method 4: Experiments
Experiments are the only data collection method that allows researchers to establish causation not just correlation. By manipulating one variable while holding others constant, and by randomly assigning participants to conditions, a well-designed experiment can determine whether X truly causes Y.
Best for: establishing cause-and-effect relationships with high internal validity.
- State a clear hypothesis. Frame it as a testable prediction: “Users who see a red ‘Buy Now’ button will convert at a higher rate than users who see a blue button.”
- Identify your independent and dependent variables. The independent variable is what you manipulate (button color). The dependent variable is what you measure (conversion rate).
- Control for confounding variables. Everything other than the independent variable should be held constant across groups same time of day, same audience, same page layout.
- Randomly assign participants to groups. Random assignment ensures the control and treatment groups are comparable. Without it, you can’t rule out pre-existing differences as the cause of any effect.
- Run the experiment and collect data. Collect enough data to achieve statistical significance. Use a power analysis in advance to determine the required sample size.
- Analyze results statistically. Use the appropriate statistical test (t-test, chi-square, ANOVA, etc.) to determine whether the difference between groups exceeds what chance alone could explain.
Real-World Example
An e-commerce company runs an A/B test: 50% of visitors see the original checkout page; 50% see a simplified version with fewer form fields. After 2 weeks and 40,000 visitors, the simplified version shows a 23% higher completion rate, and the result is statistically significant (p < 0.01). The company can confidently roll out the change, knowing the improvement was caused by the design change not by seasonal variation or audience differences.
Method 5: Secondary Data & Document Analysis
Not all data needs to be collected from scratch. Secondary data collection involves analyzing data that was previously gathered by someone else for a different (or sometimes the same) purpose. This includes government statistics, academic studies, company records, historical documents, social media archives, and more.
Best for: large-scale analysis, historical research, and preliminary literature reviews.
- Identify relevant data sources. Government databases (Census, WHO, World Bank), academic repositories, company annual reports, news archives, and publicly available datasets are all candidates.
- Evaluate source quality and bias. Ask: Who collected this data, and why? What methodology did they use? Is it current enough for your purposes? What population does it represent?
- Obtain the data legally and ethically. Respect licensing terms, copyright, and any restrictions on use.
- Clean and reformat the data. Secondary data rarely arrives ready to analyze. You may need to handle missing values, standardize formats, and merge multiple datasets.
- Analyze with awareness of original context. Remember that the data was designed for a different purpose. Be cautious about applying it to questions it wasn’t designed to answer.
Real-World Example
An economist studying the impact of minimum wage increases on employment doesn’t run a new experiment instead, she uses Bureau of Labor Statistics employment data across all 50 US states spanning 20 years, combined with a dataset of state-level minimum wage histories. By comparing employment trends in states that raised wages against those that didn’t (a “difference-in-differences” approach), she draws conclusions from real-world variation without needing to conduct a single interview or survey.
Method 6: Focus Groups
A focus group brings together 6–10 people to discuss a topic guided by a skilled moderator. The power of this method comes from group interaction: participants build on each other’s ideas, challenge each other’s assumptions, and sometimes surface insights that would never emerge in a one-on-one interview.
Best for: exploring opinions, reactions to concepts, and group dynamics in product development and marketing.
- Define the discussion topic. Focus groups work best with a specific, bounded topic reactions to a new product concept, perceptions of a brand, experiences with a service.
- Recruit a purposive sample. Aim for 6–10 participants per session who share relevant characteristics. Avoid mixing groups with very different power dynamics (e.g., managers and their direct reports in the same session).
- Prepare a discussion guide. Write 5–8 open-ended questions that move from general to specific, giving the group time to warm up before reaching the most important topics.
- Moderate with skill. The moderator’s job is to draw out quieter voices, prevent dominant personalities from hijacking the conversation, and keep discussion on track without leading participants toward any particular answer.
- Record, transcribe, and thematically analyze. Look for areas of consensus, disagreement, and unexpected angles. Run multiple groups (typically 3–5) to identify patterns across sessions.
Real-World Example
A food brand is testing three potential names for a new plant-based burger. Rather than a survey (which would just rank the names), they run four focus groups with target consumers. Through discussion, they discover that one name sounds appealing in isolation but triggers associations with “artificial ingredients” when participants discuss it together a nuance that ranking questions would have completely missed.
Method 7: Digital & Web Data Collection
The digital world generates an extraordinary volume of behavioral data continuously. Web analytics, social media data, sensor data, clickstreams, and application logs are all forms of passively collected behavioral data meaning people generate them simply by going about their lives, without responding to any questions.
Best for: large-scale behavioral analysis, trend detection, and real-time monitoring.
- Identify your data source. This could be website analytics (Google Analytics, Mixpanel), social media APIs (X/Twitter, Reddit), app event logs, IoT sensor streams, or scraped public data.
- Set up instrumentation. For web analytics, install tracking code. For APIs, configure authenticated access. For sensors, establish data pipelines to a central storage system.
- Define the events or metrics you want to capture. Be specific: page views are different from unique visitors, which are different from session duration. Garbage-in means garbage-out poorly defined metrics produce meaningless data.
- Ensure legal and ethical compliance. GDPR, CCPA, and other privacy regulations govern what data you can collect, how long you can store it, and how you must inform users. Compliance is non-negotiable.
- Clean, aggregate, and analyze. Digital data is often messy: bots inflate traffic counts, users delete cookies, and device fragmentation creates attribution challenges. Data cleaning is a major part of the work.
Real-World Example
A news website wants to understand what content keeps readers engaged. Using their analytics platform, they track scroll depth, time on page, and return visit rate for every article. Analysis reveals that long-form investigative pieces have 3× the average scroll depth of short news items suggesting their most valuable readers are those who seek depth, not breadth. This data reshapes their entire editorial strategy.
Method Comparison at a Glance
| Method | Data Type | Sample Size | Cost | Key Strength | Key Weakness |
|---|---|---|---|---|---|
| Survey | Quant/Qual | Large (100–10,000+) | Low–Med | Reach & scalability | Self-report bias |
| Interview | Qualitative | Small (5–30) | Medium–High | Depth & nuance | Time-intensive |
| Observation | Qual/Quant | Small–Medium | Medium | Actual behavior | Hawthorne effect |
| Experiment | Quantitative | Medium–Large | High | Establishes causation | Artificial conditions |
| Secondary Data | Quant/Qual | Very Large | Low | Historical breadth | Fit for purpose issues |
| Focus Group | Qualitative | Small (6–10/session) | Medium | Group dynamics | Dominant voices bias |
| Digital/Web | Quantitative | Very Large | Low (ongoing) | Passive, real-time | Privacy & ethics |
How to Choose the Right Method
No method is universally best. The right choice depends on four key factors: your research question, your available resources, your target population, and the kind of evidence you need.
Start by asking: Do I need to describe, explain, or predict? Description (What percentage of users abandon the checkout?) suits surveys and web analytics. Explanation (Why do users abandon the checkout?) suits interviews and observation. Prediction and causal inference (Does simplifying the checkout reduce abandonment?) requires experiments.
Then ask: How much depth vs. breadth do I need? If you need to represent a large, diverse population, a large-sample survey or digital data collection is the right tool. If you need to understand a few people’s experiences intimately, interviews are far more appropriate than any large-scale quantitative method.
Finally, consider triangulation using multiple methods to study the same phenomenon from different angles. A business might survey 5,000 customers to measure satisfaction broadly, then conduct 20 interviews with dissatisfied customers to understand the reasons deeply, and then run an experiment to test whether a specific change improves outcomes. Each method compensates for the weaknesses of the others.
Conclusion
Data collection is not a formality you rush through before the “real” analysis begins it is the bedrock on which all valid conclusions rest. Each method explored in this guide serves a distinct purpose: surveys offer breadth and efficiency, interviews offer depth and nuance, observation reveals what people actually do rather than what they say they do, experiments establish causation, secondary data provides historical scale, focus groups capture the texture of group opinion, and digital methods offer real-time behavioral insight at massive scale.
The most common mistakes in data collection are choosing a method out of convenience rather than appropriateness, collecting more data than necessary without a clear analytical plan, and failing to account for bias introduced by the method itself. Awareness of these pitfalls is the first step toward avoiding them.
As a general principle: let your research question guide your method, not the other way around. Start with “What do I need to know?” and work backward to “How should I gather that information?” Combined with rigorous execution, ethical data practices, and a healthy respect for what your chosen method cannot tell you, this approach will produce data you can genuinely trust and insights that hold up under scrutiny. The world increasingly runs on data. Knowing how to collect it well is one of the most transferable, valuable, and enduring skills you can develop. Data Science Blog
Frequently Asked Questions
What is the difference between primary and secondary data collection?
Primary data is information you collect yourself, directly from original sources, for a specific research purpose. Surveys you design, interviews you conduct, and experiments you run all produce primary data. Secondary data is information that was previously collected by someone else, typically for a different purpose, which you then reuse and reanalyze for your own study such as census records, published research datasets, or company transaction logs.
The key trade-off is control versus efficiency. Primary data gives you full control over what is collected and how, ensuring it precisely fits your question. Secondary data is faster and cheaper but may not perfectly match your needs, and you may have limited insight into how it was collected or what biases it contains.
How do I decide how large my sample size should be?
Sample size requirements depend on your method, your acceptable margin of error, and how large you expect any true effect to be. For quantitative research (surveys, experiments), use a power analysis this calculation incorporates your expected effect size, desired statistical power (usually 80% or 90%), and significance level (usually 5%) to determine the minimum sample you need to reliably detect a real effect if one exists.
For qualitative research (interviews, focus groups), you use the concept of “theoretical saturation” you keep collecting data until new participants stop adding new themes or insights. In practice, this is often reached somewhere between 12 and 30 interviews, though it varies by topic complexity and population diversity.
A common rule of thumb for surveys: a sample of about 400 gives a margin of error of roughly ±5% at 95% confidence, regardless of how large the total population is (assuming random sampling). For most general-purpose surveys, 400–1,000 responses is a solid target.