Measures of dispersion is statistical measure by which we determine how the observations spread out or scattered on each side of center. Variance and standard deviation is the most popular measures of dispersion. More precisely, Measures of dispersion in statistics refer to numerical values that describe the extent of variation or spread in a dataset. They provide essential insight into the distribution and consistency of data points, complementing measures of central tendency like mean or median which only reflect the middle value.

Definition of Dispersion
Dispersion is a statistical measure that indicates how the observations are spread out or scattered on each side of the center. If the value of the dispersion is small, it indicates the high uniformity of the observations. The absence of dispersion in the data indicates the perfect uniformity. So, this situation arises when all the observations are identical.
According to some scholars, the measure of dispersion is,
Riegelman: Dispersion is the extent to which the magnitude or qualities of the items differ; that is, the degree of diversity.
W.I. King.: The term dispersion is used to indicate the facts that within a given group, the items differ from another in size or other words, there is a lack of uniformity in their size.
Spiegel: The degree to which numerical data tend to spread about an average value is called the variation or dispersion of data.
B.C. Brookes and W.F.L. Dick: Dispersion or spread is the degree of the scatter or variation of the variable about a central value.
Ai- Bewley: Dispersion is the measure of the variation of the items.
A measure of dispersion appears to serve two purposes,
- It is one of the most important quantities used to characterize a frequency distribution.
- It affords a basis of comparision between two or more frequency distribution.
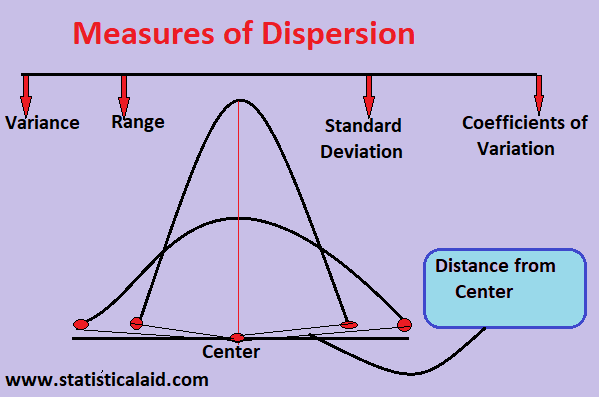
Different types of Measures of Dispersion
- Range
- Interquartile range and quartile deviation
- Mean deviation
- Median absolute deviation
- Variance
- Standard deviation, and
- Coefficient of variation.
- Range: The simplest measure, calculated as the difference between the maximum and minimum values in a dataset, showing the total spread.
- Variance: The average of the squared deviations from the mean, which quantifies how far data points typically are from the mean.
- Standard Deviation: The square root of variance, reflecting dispersion in the same units as the data. we use it the most widely because of its interpretability and mathematical properties.
- Interquartile Range (IQR): The range between the first quartile (25th percentile) and third quartile (75th percentile), focusing on the middle 50% of values and being less sensitive to outliers.
- Mean Absolute Deviation (MAD): The average of the absolute deviations from the mean, providing another measure of spread.
Characteristics of a good Measures of dispersion
- It should be based on all the observations.
- It’s unit should the same as the unit of measurement of items.
- It should be rigidly defined.
- It should follow the general rules of mathematics.
- It should not be subjected to complicated and tedious calculations.
Uses of Measures of Dispersion
Measures of dispersion are crucial because they add context to averages, helping compare different datasets, understand data reliability, and identify unusual or outlier values. For example, a low variance indicates data points are clustered close to the mean, signifying consistency, whereas high variance shows more spread and variability. In practical applications, dispersion measures are fundamental for anomaly detection models and quality control processes.
- It tells the reliability of a measure of central value.
- It makes it possible to compare two series of data in respect of their variability.
- A measure of dispersion provides the basis for the control of variability.
- It has a wide application in almost all fields of statistics.
Conclusion
Understanding and calculating measures of dispersion is vital for accurately interpreting data beyond simple averages. They reveal the variability and distribution characteristics of datasets, which is essential for tasks ranging from statistical analysis to decision-making in business, science, and engineering. Data Science Blog
Q&A
Q: Why standard deviation is the best measure of dispersion?
A: Standard deviation is favored because it uses all data points, has the same units as the data, and allows for further algebraic manipulation, making it versatile and highly interpretable.
Q: Can two datasets have the same mean but different dispersion?
A: Yes, two datasets may have identical means but very different spreads. Measures of dispersion help distinguish such differences by showing variability around the mean.
Q: What is the role of the interquartile range?
A: The interquartile range measures the spread of the middle 50% of data. It provides a robust sense of variability less affected by outliers compared to the range.
Q: When should we use mean absolute deviation?
A: Mean absolute deviation is useful when a straightforward average deviation measure is needed. Especially when outliers are less influential or when simplicity is preferred.