
Regression analysis is a statistical technique that develops a relationship between explanatory (independent) variables and response (dependent) variables. It measures the dependence of one (dependent) variable on one or more other (independent) variables.
| Linear regression |
Introduction of regression analysis
The term regression was first introduced in the nineteenth century to describe a biological phenomenon, namely that the progeny of exceptional individuals tends on average to be less exceptional than their parents and more alike their more distant ancestors. Francis Galton, cousin of Charles Darwin, studied this phenomenon. He said that the mean value of a child’s characteristic (such as height, weight etc) was not equal to his /her parents height/weight but rather was between this value and the average value of the entire population. Thus, for instance, the height of the offspring of very tall people (called by Galton, people “taller than mediocrity”) would tend to be shorter than their parents. Galton called this phenomenon ‘regression to mediocrity’.
Objectives of Regression Analysis
- Estimate the relationship between the explanatory and response variables.
- Determine the effect of each of the explanatory variables on the response variable.
- Predict the value of the response variable for a given value of an explanatory variable.
Types of regression analysis
There are various types of regression analysis based on the regression model. Such as,
- Linear Regression
- Logistic Regression
- Polynomial Regression
- Stepwise Regression
- Ridge Regression
- Lasso Regression
- Elastic Net Regression
There are three types of linear regression, i.e
- Linear regression model
- Multiple linear regression model
- Polynomial regression model
Linear regression model
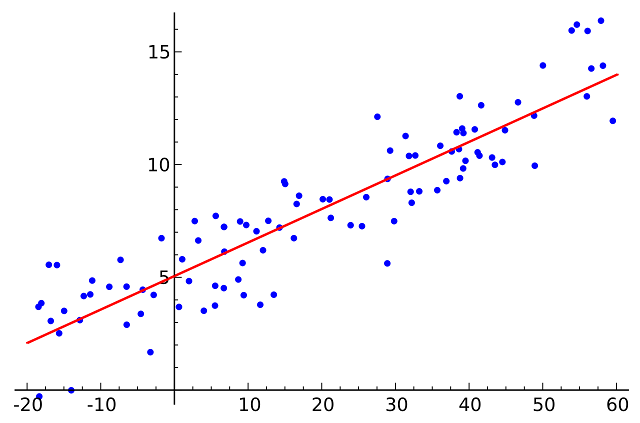
A regression model where there exists one dependent (response) variable and one independent (explanatory) variable. Linear regression is a basic predictive modeling technique used to examine the relationship between a single independent variable and a dependent variable. It assumes that there is a linear relationship between the two, meaning the change in the dependent variable is proportional to the change in the independent variable. The goal is to fit a straight line through the data points that best predicts the outcome. The straight line is known as the regression line.
Multiple linear regression model
A regression model where there exists one dependent (response) variable and more than one independent (explanatory) variable. Multiple linear regression extends the concept of linear regression by involving two or more independent variables to predict a single dependent variable. It models the linear relationship between the dependent variable and several predictors, allowing for a more comprehensive analysis of the factors influencing the outcome. This model is useful when the target variable is influenced by multiple factors, such as predicting house prices based on location, size, and number of rooms.
Polynomial regression model
A regression model where there exists one dependent (response) variable and one independent (explanatory) variable, but a polynomial function exists in the explanatory variable. Polynomial regression is a form of regression analysis where the relationship between the independent variable and the dependent variable is modeled as an n-th-degree polynomial. It is used when data shows a curvilinear trend, which a simple linear model cannot capture. By including higher-degree terms of the independent variable, polynomial regression provides greater flexibility to fit non-linear patterns in the data.
Application of the regression model
- A company might wish to improve its marketing process. After collecting data on the demand for a product, the product’s price, and the advertising expenditure incurred in promoting the product, the company might use regression analysis to develop an equation to predict the future demand on the basis of price and advertising.
- A real state company fixes the selling price of its apartments, as it claims, on the basis of the size of the apartments measured in terms of square footage of living space. A sample of 20 apartments was chosen, and the apartment owners were asked to report the size of their apartments and the price they paid. On the basis of this information, a regression analysis may be undertaken to see if there is any basis for such a claim by the company and to make a prediction of the price for a specified floor space.
- A physician collected blood samples from 50 infants on pulmonary blood flow (PBF) and pulmonary blood volume (PBV) to examine if there is any relationship between PBF and PBV. A linear regression analysis seems appropriate for the purpose of seeing if there is any such relationship.
What is the standard deviation in a regression model?

This is a common question that everybody asks about regression. In a regression model, standard deviation is the difference between the regression line and the data at each value of the independent variable.
And more simply, standard deviation = Root of Mean Square Error(RMSE)
Conclusion
Regression analysis is a fundamental statistical and machine learning tool used to understand and model the relationship between variables. It enables analysts and researchers to estimate the impact of one or more independent variables on a dependent variable, making it highly valuable in both theoretical research and real-world applications. The primary objective of regression analysis is to predict outcomes, identify trends, and determine the strength and type of relationships between variables. By doing so, it supports decision-making in various fields such as economics, healthcare, marketing, and engineering.
There are several types of regression models, each suitable for different kinds of data patterns. Linear regression is the simplest form, modeling the relationship between two variables with a straight line. Multiple linear regression expands on this by incorporating multiple predictors to explain more complex relationships. Polynomial regression, on the other hand, captures non-linear relationships by using higher-degree polynomial terms, offering more flexibility in modeling curves and trends. Other advanced forms include logistic regression for classification tasks and ridge or lasso regression for handling multicollinearity and regularization.
The applications of regression analysis are vast and diverse. Regression analysis helps forecast sales. It evaluates marketing campaigns and predicts patient outcomes in medicine. It estimates risks in finance and does much more. Overall, regression analysis is powerful. It’s a versatile technique. It provides valuable insights into data. It helps individuals and organizations. They make informed, data-driven decisions. As data continues to grow in importance, regression will remain a key analytical method in a wide range of disciplines.
Data Science Blog
Bivariate analysis using spss
Normality check using spss