
Logistic Regression is a fundamental statistical method widely used in machine learning, data science, and various fields of research. Despite its simplicity, it remains a powerful tool for binary classification problems and has numerous real-world applications ranging from medical diagnoses to customer churn prediction.
More precisely, It is a statistical technique to find the association between the categorical dependent (response) variable and one or more categorical or continuous independent (explanatory) variables.
Logistic Regression Model
We can define the logistic regression model as,
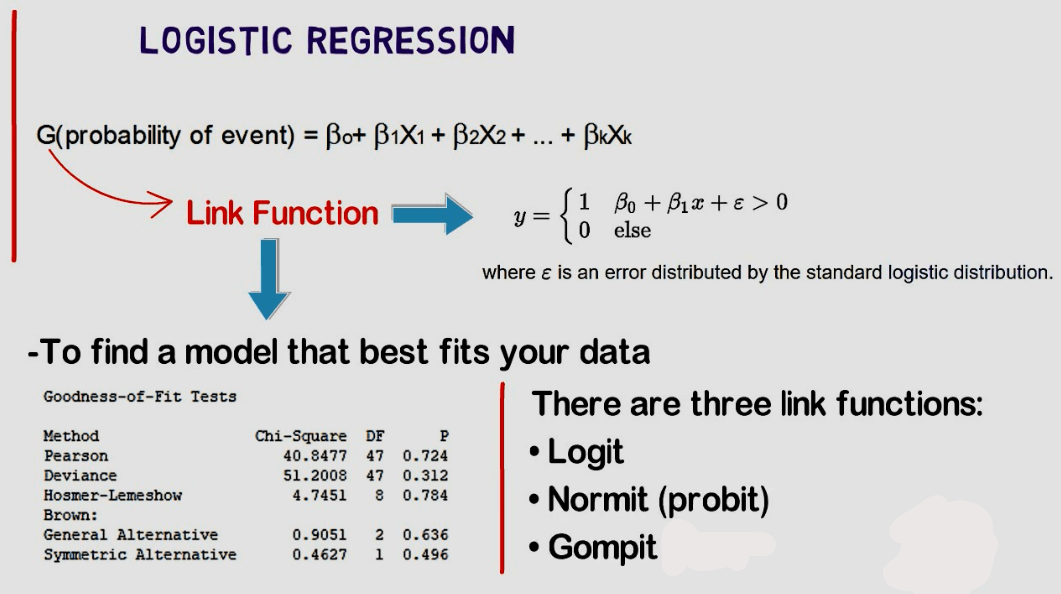
G(probability of event)=β0+β1x1+β2x2+…+βkxk
We determine G using the link function as follows,
Y={1 ; β0+β1x1+ϵ>0
{0; else
There are three types of link functions. They are,
- Logit
- Normit (probit)
- Gombit
Why use logistic regression?
We use it when it exists,
- One Categorical response variable
- One or more explanatory variables.
- No linear relationship between dependent and independent variables.
How Does Logistic Regression Work?
- Linear Combination: Logistic regression starts by calculating a linear combination of input features.
- Sigmoid Activation: The result is passed through the sigmoid function to squash the output between 0 and 1.
- Classification: The probability is then compared to a threshold (usually 0.5). If it’s above the threshold, the output is classified as 1; otherwise, it’s classified as 0.
Assumptions of Logistic Regression
- The dependent variable should be categorical (binary, ordinal, nominal, or count occurrences).
- The predictor or independent variable should be continuous or categorical.
- The correlation among the predictors or independent variable (multi-collinearity) should not be severe but there exists linearity of independent variables and log odds.
- The data should be representative part of the population and record the data in the order its collected.
- The model should provide a good fit of the data.
Logistic vs Linear regression
- In the case of Linear Regression, the outcome is continuous, while in the case of logistic regression, the outcome is discrete (not continuous)
- To perform linear regression, we require a linear relationship between the dependent and independent variables. But to perform Logit, we do not require a linear relationship between the dependent and independent variables.
- Linear Regression is all about fitting a straight line in the data, while Logit is about fitting a curve to the data.
- Linear Regression is a regression algorithm for Machine Learning, while Logit is a classification Algorithm for machine learning.
- Linear regression assumes the Gaussian (or normal) distribution of the dependent variable. Logit assumes the binomial distribution of the dependent variable.
*Logit=logistic regression
Types
There are four types of logistic regression. They are,
- Binary logistic: When the dependent variable has two categories and the characteristics are at two levels such as yes or no, pass or fail, high or low etc. then the regression is called binary logistic regression.
- Ordinal logistic: When the dependent variable has three categories and the characteristics are at a natural ordering of the levels, such as survey results (disagree, neutral, agree) then the regression is called ordinal logistic regression.
- Nominal logistic: When the dependent variable has three or more categories but the characteristics are not at a natural ordering of the levels, such as colors (red, blue, green), then the regression is called nominal logistic.
- Poisson logistic: When the dependent variable has three or more categories but the characteristics are the number of times an event occurs, such as 0, 1, 2, 3, …, etc,. then it is called Poisson logistic regression.
Advantages
| Logistic regression doesn’t require a linear relationship between dependent and independent variables. |
| The residuals don’t need to be normally distributed. |
| It is easier to implement, interpret, and very efficient to train. |
| It makes no assumptions about distributions of classes in feature space. |
| It can easily extend to multiple classes (multinomial regression) and a natural probabilistic view of class predictions. |
| It not only provides a measure of how appropriate a predictor (coefficient size) is, but also its direction of association (positive or negative). |
| It is very fast at classifying unknown records. |
| Good accuracy for many simple data sets and it performs well when the dataset is linearly separable. |
| It can interpret model coefficients as indicators of feature importance. |
| It is less inclined to over-fitting, but it can overfit in high dimensional datasets. One may consider Regularization (L1 and L2) techniques to avoid over-fitting in these scenarios. |
Disadvantages
| If the number of observations is less than the number of features, Logistic Regression should not be used; otherwise, it may lead to overfitting. |
| It constructs linear boundaries. |
| The major limitation is the assumption of linearity between the dependent variable and the independent variables. |
| It can only be used to predict discrete functions. Hence, the dependent variable is bound to the discrete number set. |
| Non-linear problems can’t be solved with logistic regression because it has a linear decision surface. Linearly separable data is rarely found in real-world scenarios. |
| It requires average or no multi-collinearity between independent variables. |
| It is tough to obtain complex relationships using logistic regression. More powerful and compact algorithms, such as Neural Networks, can easily outperform this algorithm. |
| In Linear Regression, independent and dependent variables are related linearly. But it needs that the independent variables are linearly related to the log odds (log(p/(1-p)). |
Applications of Logistic Regression
Logistic Regression is widely used across various domains:
- Healthcare: Predicting the presence or absence of a disease.
- Finance: Credit scoring and risk assessment.
- Marketing: Customer churn prediction.
- Social Sciences: Survey analysis and behavior prediction.
According to Wikipedia, Logistic regression plays a vital role across various fields, including machine learning, medicine, and the social sciences. For instance, Boyd et al. originally developed the Trauma and Injury Severity Score (TRISS) using LR to predict mortality in injured patients. Many other medical scales that assess patient severity also rely on this technique. Additionally, LR helps predict the risk of developing diseases such as diabetes or coronary heart disease, using patient characteristics like age, sex, body mass index, and blood test results. Another example might be to predict whether a Nepalese voter will vote Nepali Congress or Communist Party of Nepal, or Any Other Party, based on age, income, sex, race, state of residence, votes in previous elections, etc.
This technique finds applications in engineering for predicting the probability of failure in a process, system, or product. In marketing, it helps predict a customer’s likelihood of purchasing a product or canceling a subscription. In economics, it forecasts the probability of an individual choosing to participate in the labor force, while in business, it assesses the likelihood of a homeowner defaulting on a mortgage. Conditional random fields, which extend LR to handle sequential data, play a key role in natural language processing.
How to Implement Logistic Regression in Python
Here’s a basic implementation using the scikit-learn library:
from sklearn.model_selection import train_test_split
from sklearn.linear_model import LogisticRegression
from sklearn.metrics import accuracy_score

# Sample dataset
X_train, X_test, y_train, y_test = train_test_split(X, y, test_size=0.2, random_state=42)

# Initialize and train the model
model = LogisticRegression()
model.fit(X_train, y_train)

# Make predictions
y_pred = model.predict(X_test)

# Evaluate the model
accuracy = accuracy_score(y_test, y_pred)
print(f"Model Accuracy: {accuracy:.2f}")
Conclusion
Logistic Regression is a vital tool for any data scientist or analyst. Its simplicity, interpretability, and efficiency make it an essential algorithm for tackling binary classification problems. While it has its limitations, understanding its core mechanics and proper use cases can help you build robust and insightful predictive models.
FAQs
1. Can logistic regression (LR) handle multiclass classification?
Yes, using techniques like One-vs-Rest (OvR) or Softmax, LR can be extended for multiclass problems.
2. How do you interpret coefficients in LR?
Coefficients represent the change in the log odds of the outcome for a one-unit increase in the predictor variable.
3. What is the difference between logistic regression and linear regression?
Linear regression predicts continuous outcomes, while LR predicts probabilities of categorical outcomes.
Mastering logistic regression can provide a strong foundation for understanding more complex machine learning algorithms and enhancing your data science skills.
Try some fresh content:
- Time series analysis
- Business forecasting
- Hypothesis testing
- Logistic Regression
- Inference
- Experimental Design
- Correlation Analysis
- Data analysis using spss
- Multicollinearity