The Five Number Summary is a concise and powerful way to describe the distribution of a dataset. It provides essential information about the data’s center, spread, and overall range, allowing for quick understanding and analysis of the underlying shape and variability. This summary is widely used in exploratory data analysis, box plots, and statistical reporting. This blog post explores the concept of the Five Number Summary in detail, explains how to compute it, its practical significance, examples, visualization, and includes a conclusion and Q&A section for clarity.

What is the Five Number Summary?
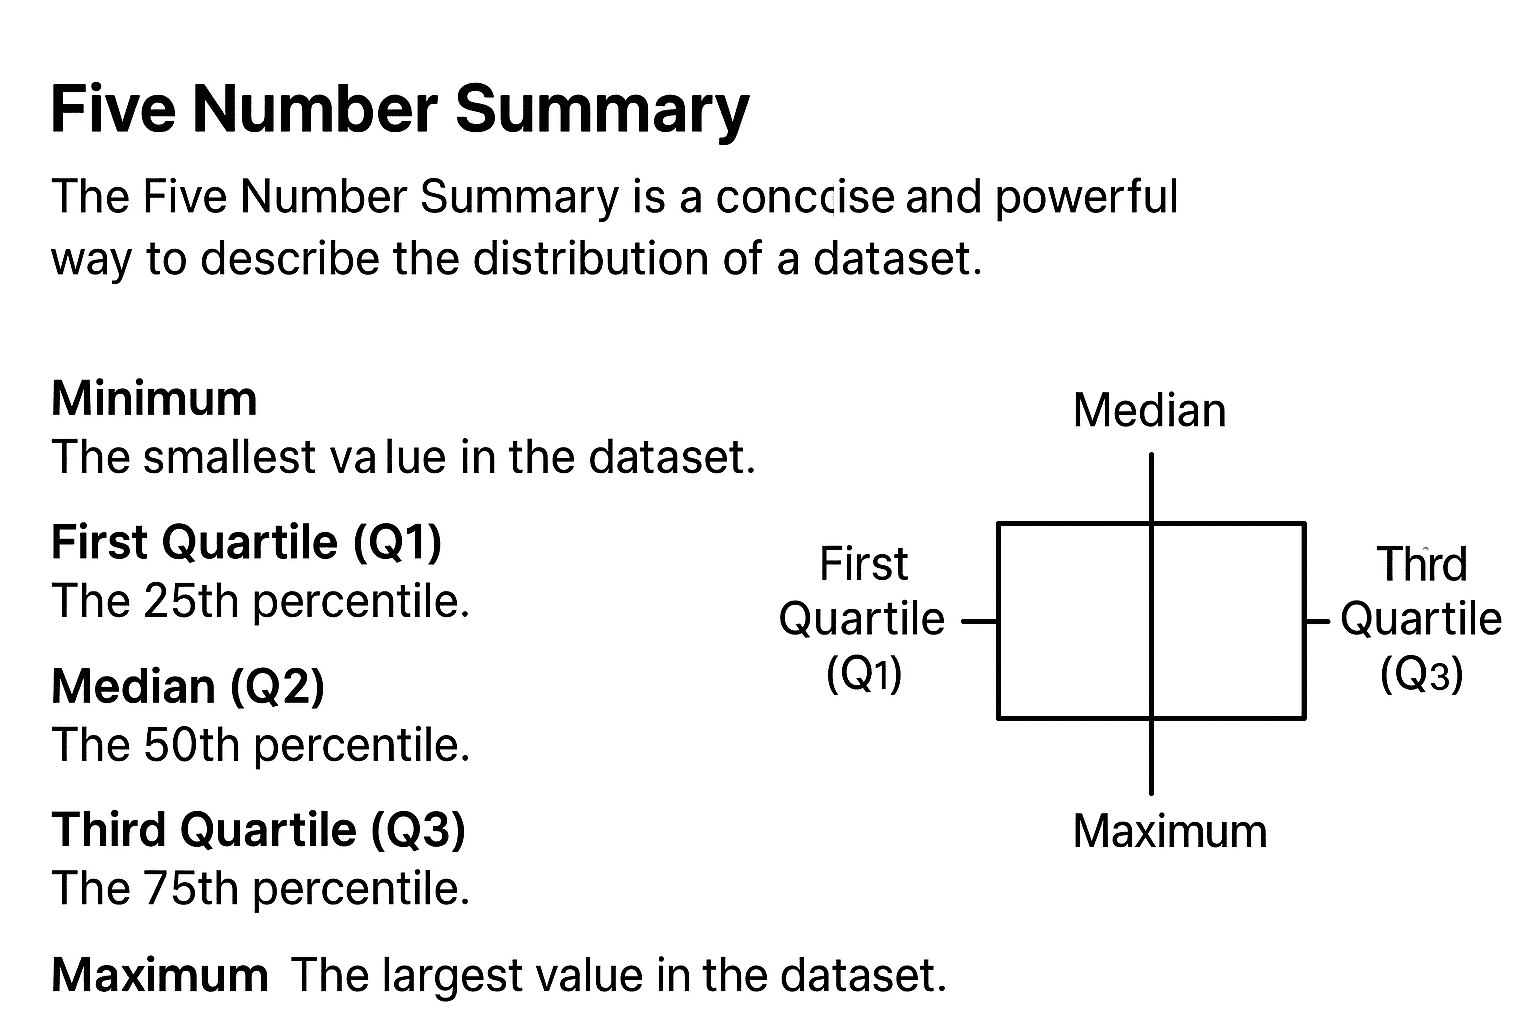
The Five Number Summary consists of five key descriptive statistics from a dataset:
- Minimum: The smallest value in the dataset.
- First Quartile (Q1): The 25th percentile; the value below which 25% of the data fall.
- Median (Q2): The 50th percentile; the middle value of the data.
- Third Quartile (Q3): The 75th percentile; the value below which 75% of the data fall.
- Maximum: The largest value in the dataset.
Together, these five statistics provide a quick snapshot of the data’s distribution, spread, and center without relying on assumptions of normality or other distribution shapes.
Computing the Five Number Summary
To compute the Five Number Summary, follow these steps:
- Sort the dataset in ascending order.
- Identify the Minimum and Maximum values.
- Find the Median (Q2): The middle value if the number of observations is odd; the average of two middle values if even.
- Calculate Q1: The median of the lower half of the dataset (values less than or equal to the median).
- Calculate Q3: The median of the upper half of the dataset (values greater than or equal to the median).
This process divides the data into four equal parts, useful in understanding distribution and skewness.
Importance of the Five Number Summary
- Robustness to Outliers: Unlike mean and standard deviation, quartiles and range are less affected by extreme values.
- Simple to Interpret: Easily communicates key data attributes, such as spread and skewness.
- Foundation for Box Plots: Box plots visually display the five number summary, highlighting distribution and potential anomalies.
- Describes Skewness: The relative distances between quartiles and median indicate skewness (left or right-tail heaviness).
- Widely Applicable: Used across many domains including finance, health, education, and social sciences.
Example Calculation
Consider this small dataset:
7,15,36,39,40,41,42,43,47,497, 15, 36, 39, 40, 41, 42, 43, 47, 497,15,36,39,40,41,42,43,47,49
Sorted data is already given. Compute:
- Minimum = 7
- Maximum = 49
- Median (Q2): Average of 5th and 6th values = (40+41)/2=40.5
- Lower half (7, 15, 36, 39, 40), Q1 = Median of lower half = 36
- Upper half (41, 42, 43, 47, 49), Q3 = Median of upper half = 43
Thus, the five number summary is: Min=7, Q1=36, Median=40.5, Q3=43, Max=49
Visualization with Box Plots
The Five Number Summary forms the backbone of a box plot or box-and-whisker plot, a graphical tool to visualize data distribution.
- The box spans from Q1 to Q3, representing the interquartile range (IQR).
- A line inside the box marks the median.
- Whiskers extend from the box to the minimum and maximum values.
- Outliers beyond the whiskers may be plotted as individual points.
Box plots provide a visual impression of skewness, symmetry, spread, and outliers effectively.
Interpreting Skewness and Spread from Five Number Summary
- Symmetric Distribution: Median is approximately centered between Q1 and Q3; whiskers roughly equal lengths.
- Right Skew: The distance between Q3 and max is larger than between min and Q1; median closer to Q1.
- Left Skew: The distance between min and Q1 is greater than between Q3 and max; median closer to Q3.
- Spread: IQR (Q3 – Q1) measures the middle 50% spread, while the range (max – min) provides overall spread.
Relationship to Other Statistics
| Statistic | Description | Sensitivity to Outliers |
|---|---|---|
| Minimum and Maximum | Extreme values in the dataset | High (affected by extremes) |
| Quartiles (Q1, Q3) | Split data into quartiles (25%, 75%) | Moderate (more robust) |
| Median | Middle value | Robust |
| Mean | Average value | Sensitive |
| Standard Deviation | Average deviation from mean | Sensitive |
Five Number Summary complements mean and standard deviation by focusing on robust measures.
Practical Applications of Five Number Summary
- Data Exploration: Provides quick insight before detailed modeling.
- Outlier Detection: Identifies unusual values for deeper investigation.
- Comparing Groups: Enables comparison of distributions across different samples.
- Reporting Descriptive Statistics: Common in research papers and reports.
Limitations
- Does not provide information about the shape beyond quartile distances.
- Sensitive to sample size — small samples may give misleading quartiles.
- Range can be misleading if outliers are present.
Conclusion
The Five Number Summary offers a quick, robust, and easily interpretable summary of data distribution that helps analysts understand central tendency, variability, and range. It is foundational for visual tools like box plots and assists in identifying skewness and outliers. While it has limitations, its simplicity makes it invaluable in early-stage data analysis, helping inform further statistical modeling or decision-making. Data Science Blog
Q&A on Five Number Summary
Q1: How is Five Number Summary different from mean and standard deviation?
A1: It uses medians and quartiles, which are less affected by outliers, providing a robust summary versus mean and standard deviation which are sensitive to extreme values.
Q2: Can Five Number Summary be used for very small datasets?
A2: It can be used but caution is needed as quartiles may not be stable or meaningful with very few observations.
Q3: Why is Five Number Summary useful for skewed data?
A3: It highlights the median and quartile distances rather than the mean, which can be pulled by skewness, giving a better picture of distribution.
Q4: How do you calculate quartiles for an odd number of data points?
A4: Median splits data into halves; quartiles are medians of those halves. Different methods (inclusive/exclusive) exist; consistency matters.
Q5: Does the Five Number Summary show multimodality?
A5: No, it summarizes spread and center but does not reveal multiple peaks; other tools like histograms or density plots are needed.