Whether you’re conducting an ANOVA test, comparing variances, or running regression analysis, the F-table is one of the most essential reference tools in inferential statistics. Yet many students and researchers find it confusing. Statistical analysis often hinges on comparing variability understanding whether observed differences are meaningful or just random noise. The F-table is a critical tool that helps make that distinction. It provides threshold values used in hypothesis testing, particularly in variance-based tests.
This comprehensive guide breaks down exactly what an F-table is, how it works, and how to use it confidently.
What is an F-Table?
An F-table (also called the F-distribution table or F-critical value table) is a reference table used in hypothesis testing to find the critical value of the F-statistic. It maps combinations of degrees of freedom and significance levels to critical values that help you decide whether to reject or fail to reject a null hypothesis.
An F-table (or F-distribution table) contains critical values from the F-distribution, which is a probability distribution used to compare two variances.
The F-statistic itself is a ratio:The table helps you decide whether your calculated F-statistic is large enough to reject the null hypothesis.
The F-Distribution Explained
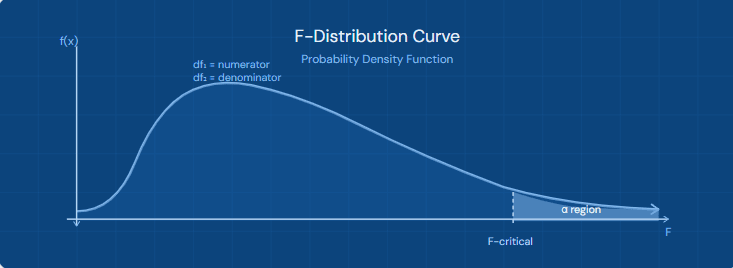
The F-distribution is a continuous probability distribution that arises frequently when comparing variances. It is always non-negative and right-skewed, defined by two parameters:
F = (SSbetween / df₁) ÷ (SSwithin / df₂)
📐df₁ (Numerator): Degrees of freedom of the group being analyzed (between groups)
📏df₂ (Denominator): Degrees of freedom within groups or of the error term
⚖️ α (Significance): Typically 0.05, 0.025, or 0.01 depending on the test
How to Read an F-Table (Step by Step)
- Determine your significance level (α) most commonly 0.05.
- Calculate the numerator degrees of freedom (df₁): number of groups minus 1.
- Calculate the denominator degrees of freedom (df₂): total observations minus number of groups.
- Find the column in the F-table that matches df₁.
- Find the row that matches df₂.
- The intersection value is your F-critical value.
Sample F-Table (α = 0.05)
Below is a partial table of F value for a significance level of 0.05. Columns represent df₁ (numerator) and rows represent df₂ (denominator).

Sample F-Table (α = 0.01)
Below is a partial table of F value for a significance level of 0.01. Columns represent df₁ (numerator) and rows represent df₂ (denominator).

Sample F-Table (α = 0.10)
Below is a partial table of F value for a significance level of 0.10. Columns represent df₁ (numerator) and rows represent df₂ (denominator).

When to Use the F-Table
🔬ANOVA Tests: Comparing means across 3 or more independent groups
📈 Regression Analysis: Testing overall significance of a regression model (F-test of overall fit)
⚗️ Variance Comparison: Levene’s test, Bartlett’s test, or comparing two population variances
🏭 Quality Control: Used in industrial settings to assess process variability and reliability
Limitations
While useful, the F-table has some drawbacks:
- Limited precision: Only provides selected values
- Manual lookup can be time-consuming
- Not practical for large datasets or complex models
- Mostly replaced today by statistical software (R, Python, SPSS, etc.)
Conclusion
The F-table remains a foundational concept in statistics, even in the age of automation. Understanding how it works strengthens your grasp of hypothesis testing and variance analysis. Whether you’re performing ANOVA or evaluating regression models, knowing how to read and apply the F-table ensures your conclusions are statistically sound.
It is a cornerstone reference in statistics, bridging the gap between raw data and meaningful hypothesis decisions. By understanding how degrees of freedom and significance levels intersect, you can confidently determine critical F-values for ANOVA, regression, and variance comparison tests.
Remember: the F-table doesn’t just give you a number it gives you a decision threshold. Master the table, and you master a crucial dimension of inferential statistics. Data Science Blog
Frequently Asked Questions
What is the difference between the F and the t-table?
The t-table is used to compare means between two groups and is based on a single degree of freedom. The F-table compares variances or means across two or more groups and requires two degrees of freedom numerator (df₁) and denominator (df₂). When you square a t-statistic, you get an F-statistic with df₁ = 1.
How do I choose the significance level (α) for the F-table?
The most common significance level is α = 0.05 (5%), which strikes a balance between Type I error (false positive) and test sensitivity. In fields requiring higher precision such as medicine or engineering α = 0.01 is preferred. Social sciences often use α = 0.05 or even α = 0.10 for exploratory research.
Can the F-statistic be negative?
No. The F-statistic is always non-negative. It is the ratio of two chi-squared distributions divided by their respective degrees of freedom, both of which yield values ≥ 0. A value close to 1.0 indicates the group variances are approximately equal, while a large F-value suggests significant differences.
What does it mean if my F-value exceeds the F-critical value?
If your calculated F-value is greater than the F-critical value from the table, you reject the null hypothesis. This means there is statistically significant evidence that at least one group mean (or variance) is different from the others. It does not, however, tell you which groups differ you’d need post-hoc tests like Tukey’s HSD for that.
Is the F-table still relevant when statistical software is available?
Yes. While software like R, SPSS, and Python’s SciPy can calculate exact p-values, the F-table remains essential for understanding the conceptual framework, validating software outputs, and working in exam or resource-limited environments. Understanding the table deepens your grasp of how test statistics relate to probability thresholds.