In probability statistics, the hypergeometric distribution is a discrete probability distribution that describes the probability of k successes in n draws, without replacement, from a finite population of size N that contains exactly K objects with that feature, wherein each draw is either a success or a failure.

Mathematical definition
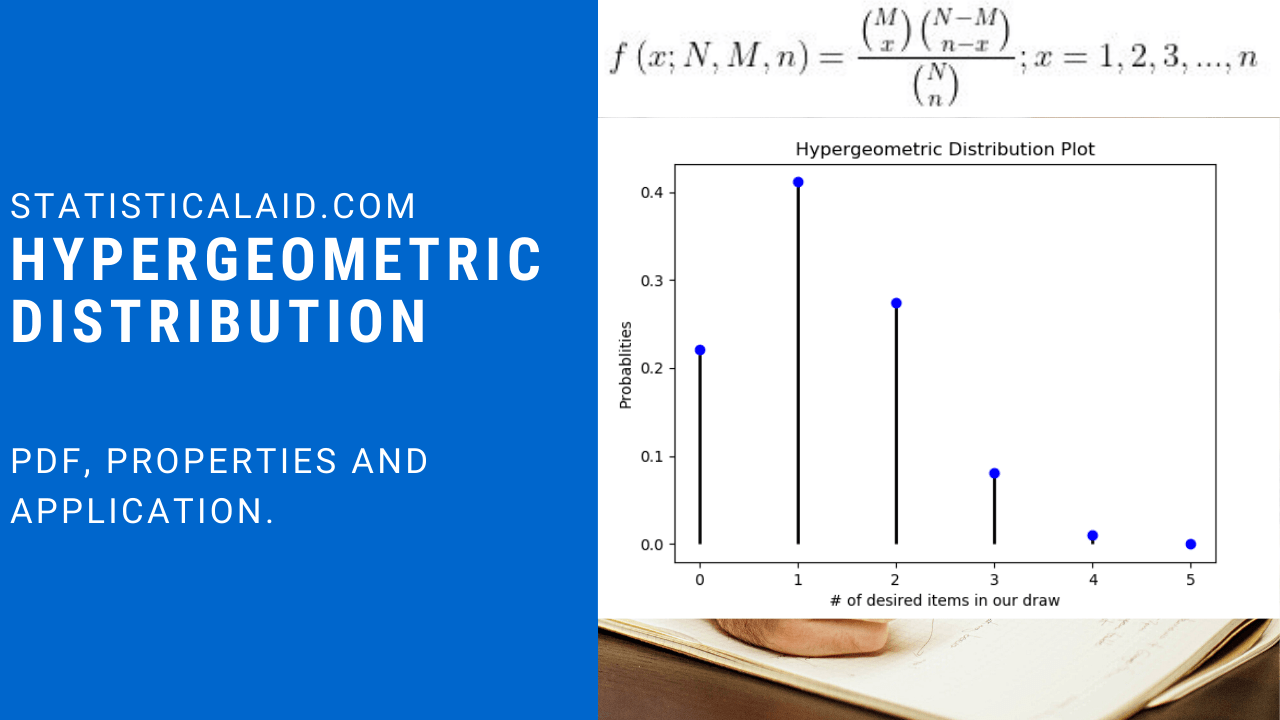
![\[ f\left (x;M,N,n \right )=\frac{\left ( _{x}^{M}\textrm{}\right )\left ( _{n-x}^{N-M}\textrm{}\right )}{\left ( _{n}^{N}\textrm{}\right )}; x= 1,2,3...,n \]](https://www.statisticalaid.com/wp-content/ql-cache/quicklatex.com-55f409c5547861f487ddb792561213de_l3.png "Rendered by QuickLaTeX.com")

Properties of Hypergeometric Distribution
- The distribution tends to binomial distribution if N➝∞ and K/N⟶p.
- Hypergeometric distribution is symmetric if p=1/2; positively skewed if p<1/2; negatively skewed if p>1/2.
- The mean of the hypergeometric distribution coincides with the mean of the binomial distribution if M/N=p.


Application of Hypergeometric Distribution
- The distribution is commonly studied in most introductory probability courses.
- In introducing students to distribution, drawing balls from an urn or selecting playing cards from a deck of cards are often discussed. This is a simple process which focus on sampling without replacement.
- We are also used the distribution to estimate the number of fishes in a lake.
- Election audits typically test a sample of machine-counted precincts to see if recounts by hand or machine match the original counts.
Hypergeometric test
The hypergeometric test uses the hypergeometric distribution to measure the statistical significance of having drawn a sample consisting of a specific number of k successes (out of n total draws) from a population of size N containing K successes. In a test for over-representation of successes in the sample, the hypergeometric p-value is calculated as the probability of randomly drawing k or more successes from the population in n total draws. In a test for under-representation, the p-value is the probability of randomly drawing k or fewer successes.
The test based on the hypergeometric distribution is identical to the corresponding one-tailed version of Fisher’s exact test. Reciprocally, the p-value of a two-sided Fisher’s exact test can be calculated as the sum of two appropriate hypergeometric tests (for more information see). The test is often used to identify which sub-populations are over- or under-represented in a sample. This test has a wide range of applications. For example, a marketing group could use the test to understand their customer base by testing a set of known customers for over-representation of various demographic subgroups (e.g., women, people under 30).
Hypergeometric vs. Binomial
| Feature | Hypergeometric Distribution | Binomial Distribution |
|---|---|---|
| Sampling method | Without replacement | With replacement |
| Population size | Finite | Infinite or large |
| Probability changes | Yes | No |
The hypergeometric distribution is preferred when dealing with small populations where probabilities significantly change with each draw.
Implementation in R and Python
R Implementation
# Calculate hypergeometric probability in R
choose(10, 3) * choose(40, 7) / choose(50, 10)

# Using dhyper function
dhyper(x = 3, m = 10, n = 40, k = 10)
Python Implementation
from scipy.stats import hypergeom

# Parameters
N, K, n, k = 50, 10, 10, 3

# Compute probability
prob = hypergeom.pmf(k, N, K, n)
print(prob)
Conclusion
The hypergeometric distribution is a fundamental concept in probability theory with extensive applications in various fields. Understanding its properties, differences from the binomial distribution, and how to implement it in R and Python can help in accurate data analysis and decision-making.
By mastering this distribution, you can enhance your statistical toolkit and apply it to real-world scenarios effectively. Data Science Blog