What is SPSS?
SPSS is a statistical software which was actually developed as an analysis program for social scientist . Abbreviation of SPSS is Statistical Package for Social Science and now it is modified to Superior Performing Software. Data analysis using SPSS for beginners is an article which helps you understand the basic facts of data analysis using SPSS.
Why we use SPSS to analyze data?
Data analysis using SPSS is very popular because it performs four main tasks:
- Manipulates and manages data
- Products reports and table
- Perform simple and complex statistical analysis
- Produces graphical output
Interface:
Mainly there are four window-
1.data editor
2.output viewer
3.syntax editor
4.script windows
There are two interface in data editor.
i. Variable view:
In this view , we can insert our variable name .
| Variable view |

ii. Data view:
In this view , we can input our data for our inserted variable.
| Data view |

How to enter data in SPSS?
- Manually
- Import data from excel
Manually entering data:
| Manually entering data |

- After open spss software , at first we have to write the variable name in the “Name” column.
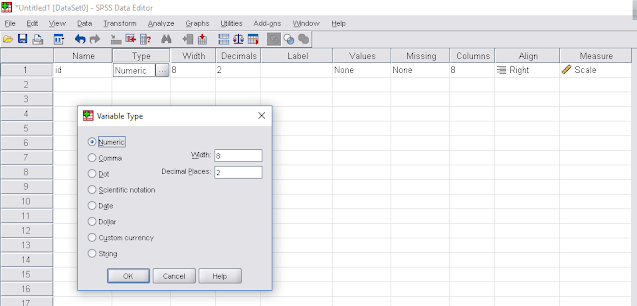
- click on “Type” and select the variable type.
- then we have to write the variable description in the “Label” column.
If we want entering a string variable or nominal data, then we have to select the variable type as “String”
| Selecting variable type |

| Add value labels |

Try some new contents about data analysis and statistics:
- Time series analysis
- Business forecasting
- Hypothesis testing
- Logistic Regression
- Inference
- Experimental Design
- Correlation Analysis
- Data analysis using spss
- Data entry in SPSS
- Import data in SPSS from excel file
- Sort data in SPSS
- Merge data set in SPSS
- Finding, Replacing and Coding missing values in SPSS
- Variable transformation, Recoding variables in spss
- Bivariate analysis in spss
- Normality check in spss